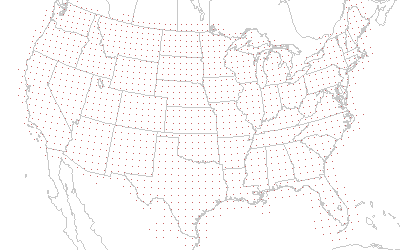

Tornado segment environment data based on data from:
Mode environment data based on data from:
Mode classification based on data from:
Mode classification for tropical cyclone tornadoes based on data from:

RELATIVE FREQUENCY

|

COUNT PER DECADE

|
|
• Box and whisker plots show middle two quartiles in red with respective 25th, 50th, and 75th percentile values. • The whiskers extend to the 10th and 90th percentile values. Extreme values are noted with black dots. • An area must have at least 10 cases to produce plots. • "Cold Season" is defined as the period between Oct 15th and Feb 15th. Contacts for this resource: Bryan Smith, SPC, or Richard Thompson, SPC This data browser was developed by John Hart, SPC. 

| |


