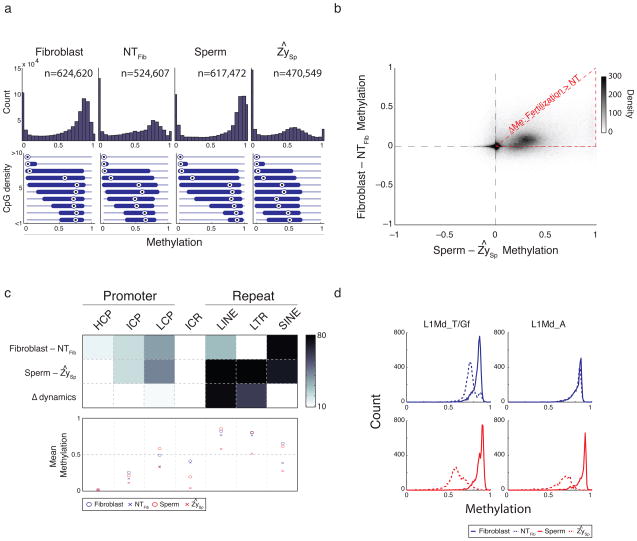
Figure 1. Classifying common and distinct DNA methylation dynamics during fertilization and nuclear transfer.
a. Histogram of methylation (top) and boxplots of methylation by CpG density (bottom) for 100 bp tiles in fibroblast, nuclear transfer reconstructed embryos (NTFib, mean of 4 replicates), sperm, and the inferred sperm value in zygote (ZySp; see Supplementary Methods). Fibroblasts and sperm show a global methylation pattern typical of somatic tissues while SCNT embryos (NTFib) exhibit a similar global shift as ZySp. Bulls-eye indicates the median, edges the 25th/75th percentile and whiskers the 2.5th/97.5th percentile.
b. Scatterplot comparing global methylation dynamics between nuclear transfer (Fibroblast – NTFib) and fertilization (Sperm – ZySp). While demethylated regions appear to occur in common sites (upper right quadrant), the magnitude of demethylation is larger during fertilization as indicated by the dense cloud below the diagonal. The red triangle outlines the region where demethylation after SCNT is smaller than during fertilization.
c. Heatmap (top) depicting genomic features that significantly change (dark) in Fibroblast-NTFib or Sperm-ZySp transitions, and the comparison of changes between the two transitions (Δ dynamics). Promoters are partitioned to high (H), intermediate (I) or low (L) CpG density and known imprint control regions (ICRs) are included as a control set. Color is the –log p-value. The mean methylation value for each feature set is shown in the bottom panel. Most features appear to change similarly in both processes with the exception of LINE and LTR features, which are comparably resistant to change after nuclear transfer.
d. Histogram of methylation for elements in the L1Md_T and L1Md_Gf (left) and L1Md_A (right) families of the LINE-1 class. Both families are dynamic during fertilization, but only the L1Md_T/Gf families, which show larger demethylation during fertilization, show any detectable change after nuclear transfer.
