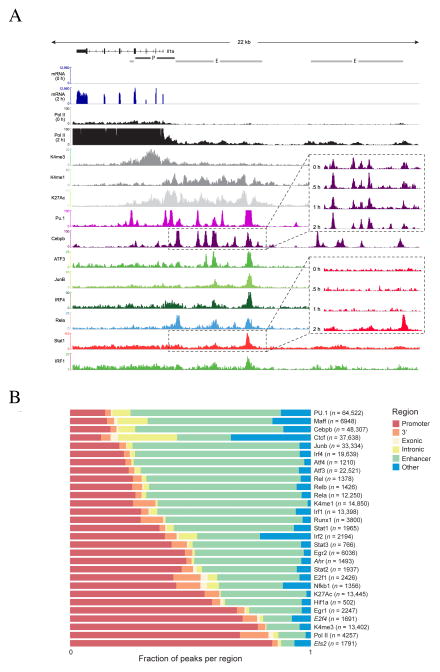
Figure 2. Epigenetic and transcription factor binding landscape.
A. Representative Integrative Genomics Viewer (IGV) tracks, in the Il1a loci showing RNA-Seq expression and “compressed” alignments for selected TFs and histone modifications (Supplemental text). Enhancer and promoter calls (Methods) are shown on top. Call-out boxes show time course data for selected factors. B. Distribution of the peaks across promoter, 3′UTR, exonic, intronic, enhancer and unannotated, regions. Each bar shows the fraction of peaks that overlap each region type. The total number of peaks is shown in parenthesis. Factors in italics indicate that the motif shown is not the canonical binding motif for the factor.
