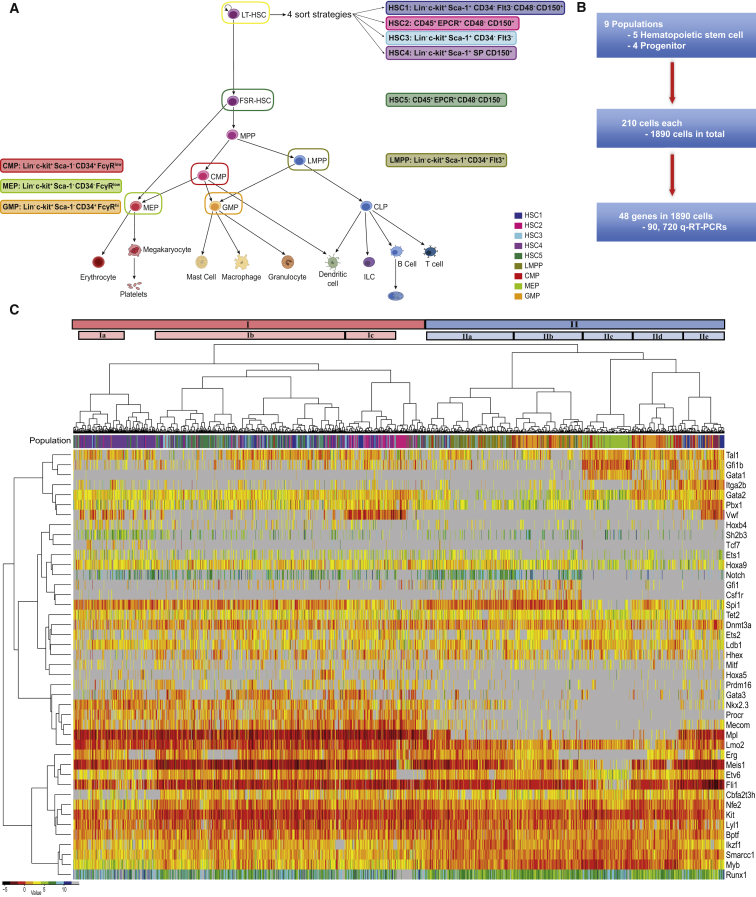
Figure 1.
Single-Cell Expression Analysis Reveals an Overlapping Molecular Signature for Four Heterogeneous HSC Populations
(A) Schematic of the hematopoietic tree. The cell types highlighted are populations that will be further investigated within this study; the colors and names remain constant throughout the text. The individual sorting strategies are also highlighted next to the appropriate cell population. HSC1 (dark blue, Lin−c-kit+Sca-1+CD34−Flt3−CD48−CD150+), HSC2 (pink, Lin−CD45+EPCR+CD48−CD150+), HSC3 (cyan, Lin−c-kit+Sca-1+CD34−Flt3−), HSC4 (orchid, Lin−c-kit+Sca-1+SP CD150+), HSC5 (seagreen, Lin−CD45+EPCR+CD48−CD150−), LMPP (yellow, Lin−c-kit+Sca-1+CD34+Flt3+), CMP (red, Lin−c-kit+Sca-1−CD34+FcγRlow), MEP (yellow-green, Lin−c-kit+Sca-1−CD34−FcγRlo) and GMP (orange, Lin−c-kit+Sca-1−CD34+FcγRhi).
(B) Flow diagram of single-cell qRT-PCR.
(C) Unsupervised hierarchical clustering of gene expression for all investigated cell populations. Colored bar (population) above heat map indicates the cell population (colors are the same as in A). Intensity of heat map is based on the ΔCt, black is highest expressed—dark blue is lowest, and gray is not detected. The distances of the population dendrogram are not proportional to the dissimilarity.
