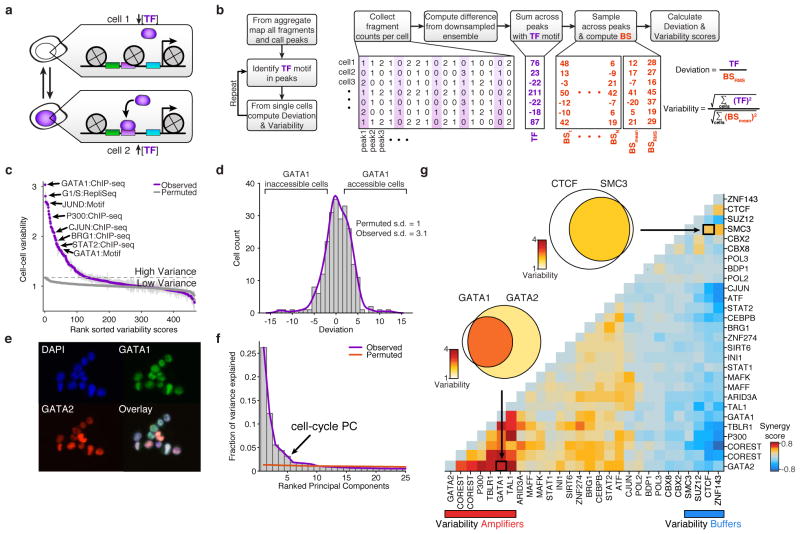
Figure 2. Trans-factors are associated with single-cell epigenomic variability.
(a) Schematic showing two cellular states (TF high and TF low) leading to differential chromatin accessibility. (b) Analysis infrastructure, which uses a calculated background signal (BS; see Supplemental Methods section 3.2) to calculate TF deviations and variability from scATAC-seq data. The TF value is calculated by subtracting the number of expected fragments from the observed fragments per cell (see Supplemental Methods section 3.1). (c) Observed cell-to-cell variability within sets of genomic features associated with ChIP-seq peaks, transcription factor motifs, and replication timing (error estimates shown in grey, see Methods for details). Variability measured from permuted background (see Methods) is shown in grey dots. (d) Distribution of normalized deviations from expected accessibility signal for GATA1 sites in individual cells, histogram of cells shown in grey, density profile shown in purple (see Methods). (e) Immunostaining of GATA1 (green) and GATA2 (red) shows protein expression in K562s. (f) Principal components ranked by fraction of variance explained from observed data (purple) and permuted data (orange). Bar plot of observed data shown in grey. (g) Calculated changes in associated variability of factors when present together versus independently, depicting a context-specific trans-factor variability landscape (see Methods). Venn-diagrams show variability associated with GATA1 and/or GATA2 and CTCF and/or SMC3 (co-) occurring ChIP-seq sites.
