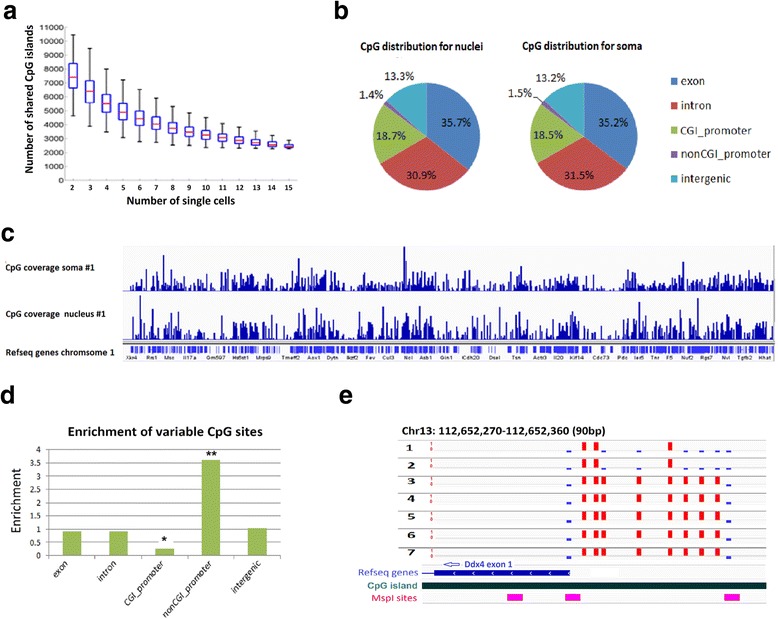
Fig. 2.

DNA methylome analysis of single DRG neuronal nucleus. a Boxplots showing the distribution of overlapping CGIs between randomly sampled number of cells as indicated on the x-axis. b Pie chart with the genomic distribution of all CpG sites detected in nucleus and soma RRBS libraries. c Genome browser tracks showing the coverage of CpG sites for chromosome 1 that are covered by soma methylome (top) or nucleus methylome (bottom). d Bar graph showing the genomic features that are enriched for differentially methylated CpG sites across scRRBS libraries. * and ** indicate differential distribution of differentially methylated CpG sites at CpG island promoter and non-CpG island promoter region, respectively (p <10−8, binomial test). e The heterogeneous methylation status of a representative locus at promoter region of Ddx4. Red bars indicate the methylated CpG sites, blue bars indicate the unmethylated CpG sites