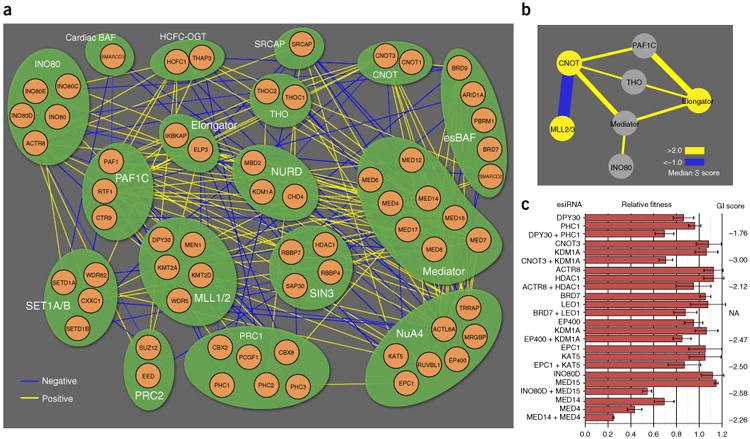
Figure 2.

Module map of chromatin-related genes, based on a curated set of the indicated protein complexes. (a) Network representation of significant negative (blue) and positive (yellow) genetic interactions. (b) Intermodule connectivity map with negative (blue) and positive (yellow) edges. Edge thickness indicates interaction magnitude. (c) Validation of select GIs with esiRNA for eight interaction pairs. Calculated S scores (with the exception of BRD7 + LEO1, which was removed during the data-filtering process but was predicted to be negative) (Supplementary Fig. 6b,d) from the pooled double-CRISPRi screen are shown at right. Error bars, s.d. Number of technical replicates (n) = 3 for CNOT3 + KDM1A, BRD7 + LEO1, LEO1, EPC1 + KAT5, KAT5, INO80D + MED15, INO80D, MED14 + MED4 and MED4; n = 4 for all other measurements; NA, S score not measured.