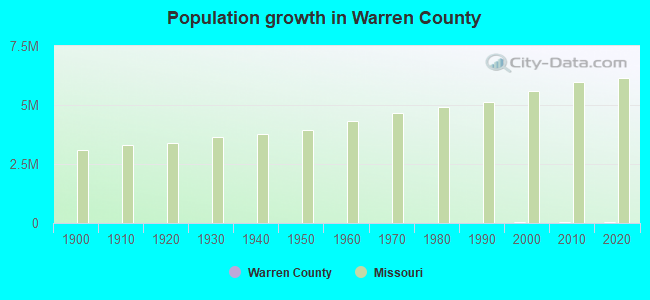
County population in 2023: 36,632 (37% urban, 63% rural); it was 24,525 in 2000County owner-occupied with a mortgage or a loan houses and condos in 2010: 6,916 County owner-occupied free and clear houses and condos in 2010: 2,898 County owner-occupied houses and condos in 2000: 7,633 Renter-occupied apartments: 2,525 (it was 1,552 in 2000)
% of renters here:
17%
State:
31%
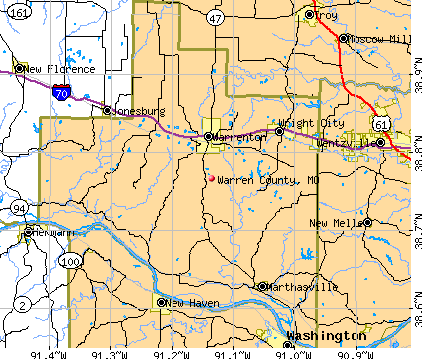
Land area: 431 sq. mi.
Water area: 6.4 sq. mi.
Population density: 85 people per square mile (average).
March 2022 cost of living index in Warren County: 87.3 (less than average, U.S. average is 100)
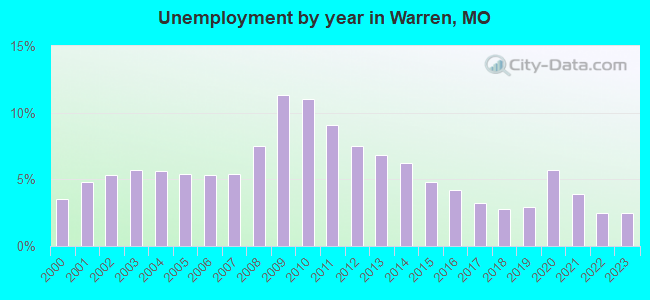
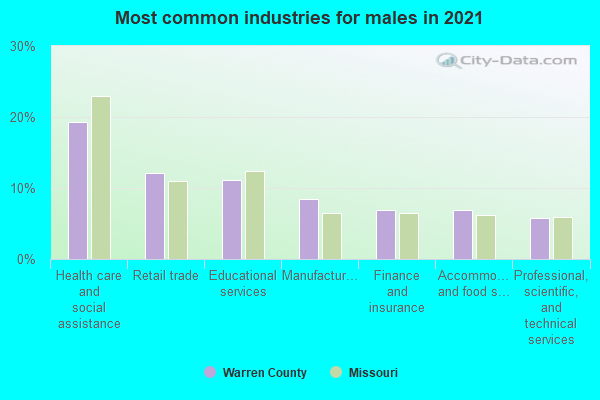
Industries providing employment: Educational, health and social services (19.8%), Manufacturing (14.7%), Construction (13.4%), Retail trade (12.3%).
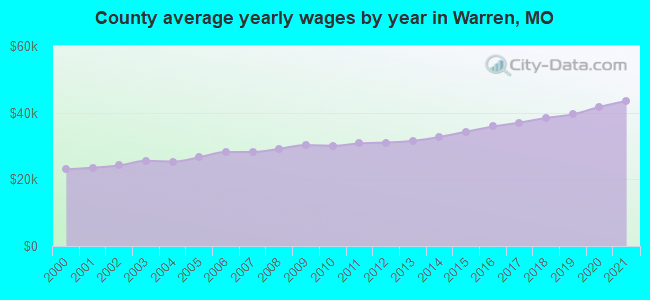
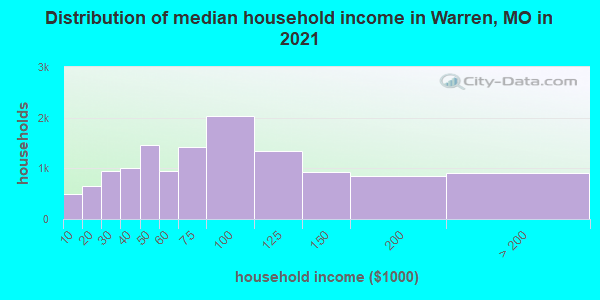
Estimated median household income in 2023: $77,564 ($41,016 in 1999)
This county:
$77,564
Missouri:
$68,545
Median contract rent in 2023 for apartments: $777 (lower quartile is $547, upper quartile is $1,101)
This county:
$777
State:
$823
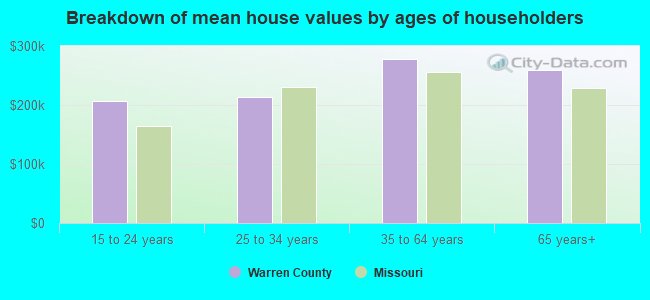
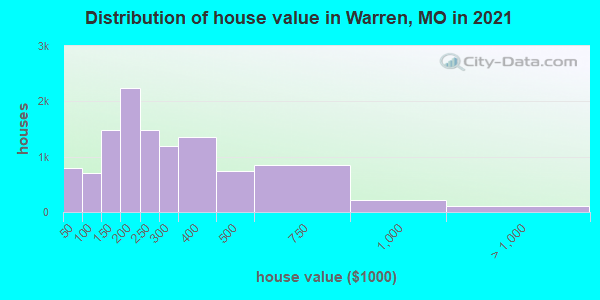
Estimated median house or condo value in 2023: $261,337 (it was $101,600 in 2000)
Warren:
$261,337
Missouri:
$233,600
Lower value quartile - upper value quartile: $192,840 - $398,561 Median monthly housing costs for homes and condos with a mortgage: $1,449 Median monthly housing costs for units without a mortgage: $488
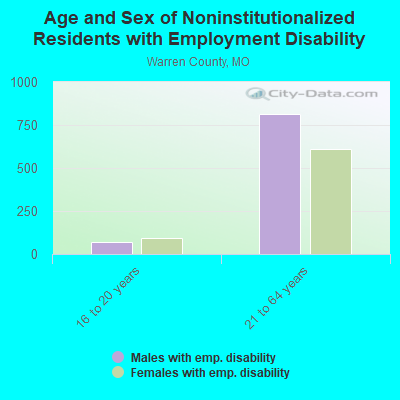
Institutionalized population: 193
Crime in 2022 (reported by the sheriff's office or county police, not the county total):
Murders: 0
Rapes: 7
Robberies: 0
Assaults: 16
Burglaries: 17
Thefts: 102
Auto thefts: 22
Crime in 2021 (reported by the sheriff's office or county police, not the county total):
Murders: 0
Rapes: 12
Robberies: 0
Assaults: 31
Burglaries: 53
Thefts: 116
Auto thefts: 48
Health of residents in Warren County based on CDC Behavioral Risk Factor Surveillance System Survey Questionnaires from 2013 to 2021:
General health status score of residents in this county from 1 (poor) to 5 (excellent) is 3.4. This is about average. 71.9% of residents exercised in the past month. This is about average. 45.2% of residents smoked 100+ cigarettes in their lives. This is about average. 53.7% of adult residents drank alcohol in the past 30 days. This is less than average. 67.3% of residents visited a dentist within the past year. This is about average. Average weight of males is 200 pounds. This is more than average. Average weight of females is 167 pounds. This is more than average.
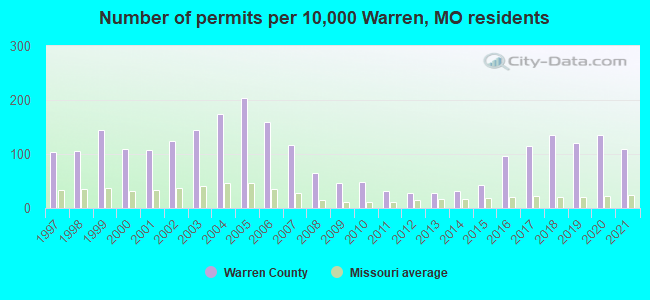
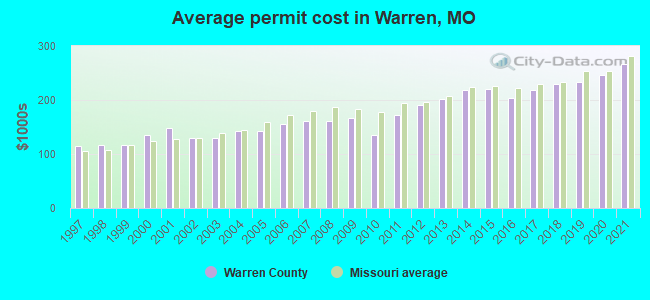
Single-family new house construction building permits:
2022: 214 buildings, average cost: $298,400
2021: 267 buildings, average cost: $265,600
2020: 334 buildings, average cost: $246,400
2019: 295 buildings, average cost: $232,900
2018: 332 buildings, average cost: $228,500
2017: 282 buildings, average cost: $217,600
2016: 238 buildings, average cost: $203,700
2015: 103 buildings, average cost: $220,000
2014: 75 buildings, average cost: $218,900
2013: 68 buildings, average cost: $202,000
2012: 65 buildings, average cost: $190,200
2011: 75 buildings, average cost: $173,400
2010: 118 buildings, average cost: $136,200
2009: 115 buildings, average cost: $166,200
2008: 160 buildings, average cost: $160,900
2007: 286 buildings, average cost: $161,500
2006: 389 buildings, average cost: $155,200
2005: 497 buildings, average cost: $142,000
2004: 428 buildings, average cost: $142,000
2003: 354 buildings, average cost: $129,100
2002: 307 buildings, average cost: $129,800
2001: 265 buildings, average cost: $147,800
2000: 269 buildings, average cost: $134,500
1999: 356 buildings, average cost: $117,300
1998: 259 buildings, average cost: $117,200
1997: 256 buildings, average cost: $114,000
Median real estate property taxes paid for housing units with mortgages in 2023: $1,844 (0.7%) Median real estate property taxes paid for housing units with no mortgage in 2023: $1,747 (0.7%)
Percentage of residents living in poverty in 2023: 8.8%
Warren County:
8.8%
Missouri:
12.0%
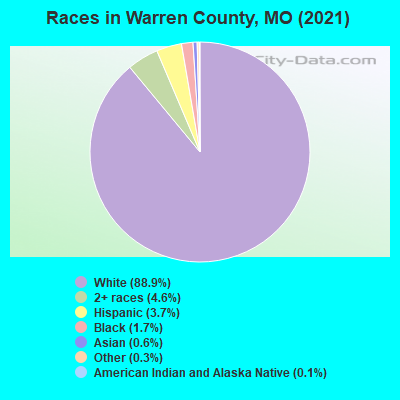
(8.0% for White Non-Hispanic residents, 6.7% for Black residents, 4.5% for Hispanic or Latino residents, 1.7% for American Indian residents, 9.3% for other race residents, 19.5% for two or more races residents)
Median age of residents in 2023: 41.2 years old
(Males: 40.6 years old, Females: 42.2 years old)
(Median age for: White residents: 42.6 years old, Black residents: 38.3 years old, American Indian residents: 16.3 years old, Asian residents: 39.2 years old, Hispanic or Latino residents: 23.1 years old, Other race residents: 25.4 years old)
Area name: St. Louis, MO-IL HUD Metro FMR Area Fair market rent in 2006 for a 1-bedroom apartment in Warren County is $526 a month. Fair market rent for a 2-bedroom apartment is $654 a month. Fair market rent for a 3-bedroom apartment is $842 a month.
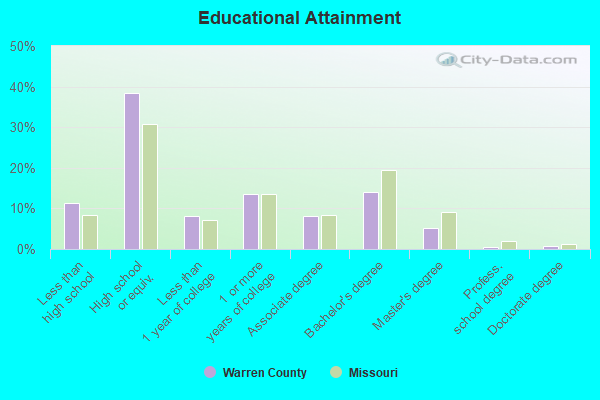
Current college students: 664 People 25 years of age or older with a high school degree or higher: 89.2% People 25 years of age or older with a bachelor's degree or higher: 19.6%
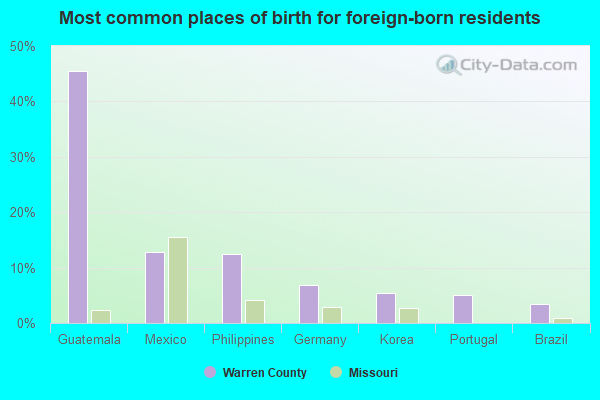
Number of foreign born residents: 448 (61.6% naturalized citizens)
Warren County:
1.2%
Whole state:
4.8%
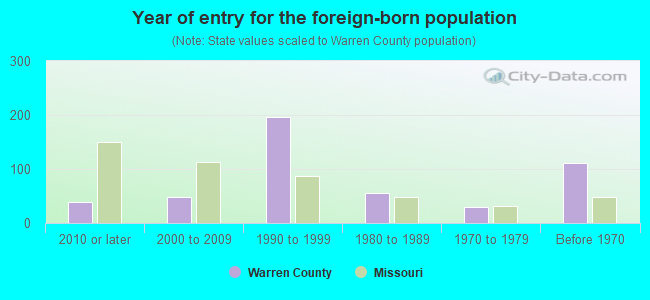
Year of entry for the foreign-born population
442010 or later
1472000 to 2009
1631990 to 1999
551980 to 1989
291970 to 1979
111Before 1970
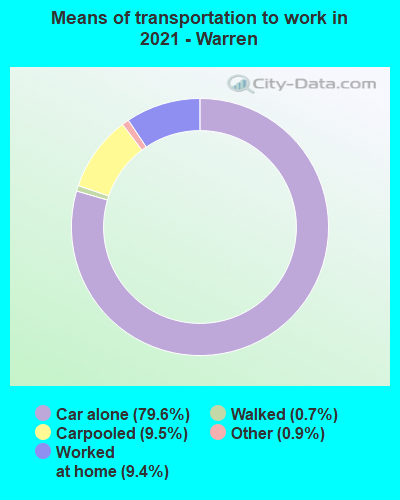
Mean travel time to work (commute): minutes
Percentage of county residents living and working in this county: 99.6%
Housing units in structures:
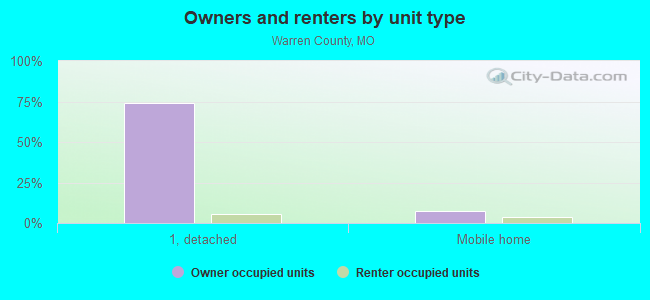
One, detached: 12,805
One, attached: 496
Two: 168
3 or 4: 486
5 to 9: 303
10 to 19: 111
20 to 49: 35
50 or more: 21
Mobile homes: 1,479
Boats, RVs, vans, etc.: 55
Housing units in Warren County with a mortgage: 7,601 (537 second mortgage, 130 home equity loan, 297 both second mortgage and home equity loan) Houses without a mortgage: 161
Here:
4.2% with mortgage
State:
97.7% with mortgage
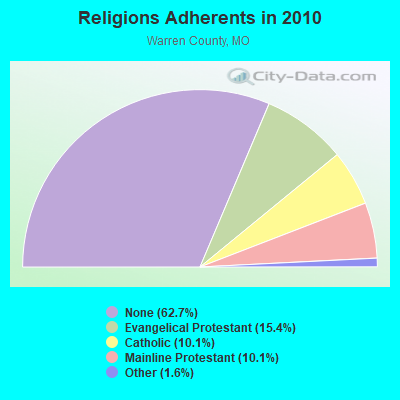
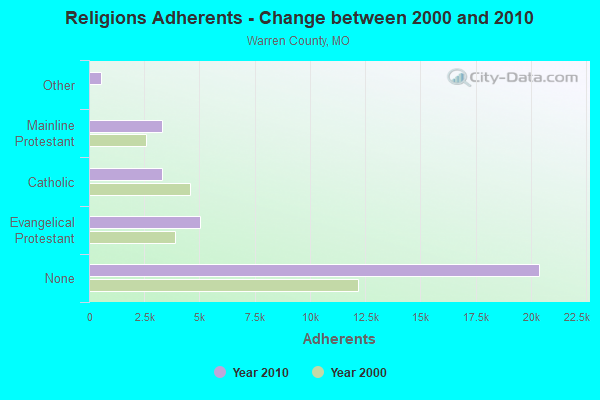
Religion statistics for Warren County
Religion
Adherents
Congregations
Evangelical Protestant
5,021
19
Catholic
3,288
3
Mainline Protestant
3,285
13
Other
524
3
None
20,395
-
Warren County Religion Details
Source: Clifford Grammich, Kirk Hadaway, Richard Houseal, Dale E.Jones, Alexei Krindatch, Richie Stanley and Richard H.Taylor. 2012. 2010 U.S.Religion Census: Religious Congregations & Membership Study. Association of Statisticians of American Religious Bodies. Jones, Dale E., et al. 2002. Congregations and Membership in the United States 2000. Nashville, TN: Glenmary Research Center.
Food Environment Statistics:
Number of grocery stores: 3
Warren County:
0.99 / 10,000 pop.
State:
1.88 / 10,000 pop.
Number of convenience stores (no gas): 2
This county:
0.66 / 10,000 pop.
Missouri:
0.60 / 10,000 pop.
Number of convenience stores (with gas): 10
Warren County:
3.29 / 10,000 pop.
Missouri:
4.34 / 10,000 pop.
Number of full-service restaurants: 18
This county:
5.92 / 10,000 pop.
State:
7.37 / 10,000 pop.
Adult diabetes rate:
Warren County:
8.7%
Missouri:
8.8%
Adult obesity rate:
Warren County:
29.9%
State:
29.6%
Low-income preschool obesity rate:
Here:
15.2%
State:
13.5%
Agriculture in Warren County:
Average size of farms: 211 acres Average value of agricultural products sold per farm: $28,489 Average value of crops sold per acre for harvested cropland: $177.97 The value of nursery, greenhouse, floriculture, and sod as a percentage of the total market value of agricultural products sold: 6.47% The value of livestock, poultry, and their products as a percentage of the total market value of agricultural products sold: 37.22% Average total farm production expenses per farm: $24,764 Harvested cropland as a percentage of land in farms: 47.53% Irrigated harvested cropland as a percentage of land in farms: 1.91% Average market value of all machinery and equipment per farm: $53,598 The percentage of farms operated by a family or individual: 88.06% Average age of principal farm operators: 56 years Average number of cattle and calves per 100 acres of all land in farms: 8.20 Milk cows as a percentage of all cattle and calves: 1.19% Corn for grain: 17517 harvested acres All wheat for grain: 2869 harvested acres Soybeans for beans: 31143 harvested acres Vegetables: 118 harvested acres Land in orchards: 282 acres
Earthquake activity:
Warren County-area historical earthquake activity is significantly above Missouri state average. It is 346% greater than the overall U.S. average.
On 4/18/2008 at 09:36:59, a magnitude 5.4 (5.1 MB, 4.8 MS, 5.4 MW, 5.2 MW, Class: Moderate, Intensity: VI - VII) earthquake occurred 177.0 miles away from Warren County center On 4/18/2008 at 09:36:59, a magnitude 5.2 (5.2 MW, Depth: 8.9 mi) earthquake occurred 177.0 miles away from the county center On 9/26/1990 at 13:18:51, a magnitude 5.0 (4.7 MB, 4.8 LG, 5.0 LG, Depth: 7.7 mi) earthquake occurred 140.9 miles away from the county center On 6/10/1987 at 23:48:54, a magnitude 5.1 (4.9 MB, 4.4 MS, 4.6 MS, 5.1 LG) earthquake occurred 175.3 miles away from the county center On 5/4/1991 at 01:18:54, a magnitude 5.0 (4.4 MB, 4.6 LG, 5.0 LG, Depth: 3.1 mi) earthquake occurred 168.4 miles away from Warren County center On 6/18/2002 at 17:37:15, a magnitude 5.0 (4.3 MB, 4.6 MW, 5.0 LG) earthquake occurred 189.8 miles away from the county center Magnitude types: regional Lg-wave magnitude (LG), body-wave magnitude (MB), surface-wave magnitude (MS), moment magnitude (MW)
Most recent natural disasters:
Missouri Covid-19 Pandemic, Incident Period: January 20, 2020, FEMA Id: 4490, Natural disaster type: Other
Missouri Severe Storms, Tornadoes, Straight-line Winds, and Flooding, Incident Period: December 22, 2015 to January 09, 2016, Emergency Declared EM-3374: January 02, 2016, FEMA Id: 3374, Natural disaster type: Storm, Tornado, Flood, Wind
Missouri Flooding, Incident Period: June 01, 2011 to August 01, 2011, Emergency Declared EM-3325: June 30, 2011, FEMA Id: 3325, Natural disaster type: Flood
Missouri Severe Winter Storm, Incident Period: January 31, 2011 to February 05, 2011, Emergency Declared EM-3317: February 03, 2011, FEMA Id: 3317, Natural disaster type: Winter Storm
Missouri Severe Winter Storm, Incident Period: January 26, 2009 to January 28, 2009, Emergency Declared EM-3303: January 30, 2009, FEMA Id: 3303, Natural disaster type: Winter Storm
Missouri Severe Winter Storms, Incident Period: December 08, 2007 to December 15, 2007, Emergency Declared EM-3281: December 12, 2007, FEMA Id: 3281, Natural disaster type: Winter Storm
Missouri Severe Winter Storms, Incident Period: December 06, 2007 to December 15, 2007, Major Disaster (Presidential) Declared DR-1736: December 27, 2007, FEMA Id: 1736, Natural disaster type: Winter Storm
Missouri Hurricane Katrina Evacuation, Incident Period: August 29, 2005 to October 01, 2005, Emergency Declared EM-3232: September 10, 2005, FEMA Id: 3232, Natural disaster type: Hurricane
Missouri Severe Thunderstorms And Flash Flooding, Incident Period: May 06, 2000 to May 07, 2000, FEMA Id: 1328, Natural disaster type: Storm, Flash Flood
Missouri Severe Storm, Tornadoes, Hail, Flooding, Incident Period: May 13, 1995 to June 23, 1995, Major Disaster (Presidential) Declared DR-1054: June 02, 1995, FEMA Id: 1054, Natural disaster type: Storm, Tornado, Flood
4 other natural disasters have been reported since 1953.
The number of natural disasters in Warren County (14) is near the US average (15). Major Disasters (Presidential) Declared: 5 Emergencies Declared: 7
Causes of natural disasters: Floods: 6, Storms: 5, Winter Storms: 4, Tornadoes: 3, Drought: 1, Flash Flood: 1, Heavy Rain: 1, Hurricane: 1, Wind: 1, Other: 1 (Note: some incidents may be assigned to more than one category).
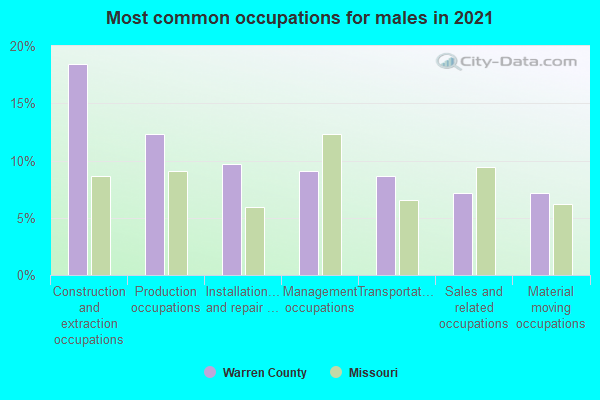
Installation, maintenance, and repair occupations (9%)
Transportation occupations (6%)
Material moving occupations (6%)
Sales and related occupations (5%)
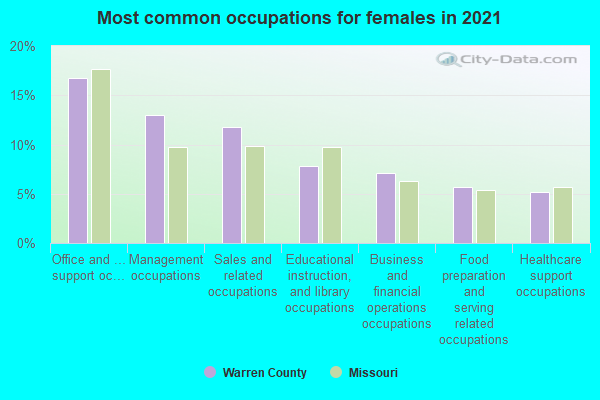
Office and administrative support occupations (18%)
Management occupations (12%)
Sales and related occupations (11%)
Educational instruction, and library occupations (9%)
Food preparation and serving related occupations (7%)
Business and financial operations occupations (7%)
Health diagnosing and treating practitioners and other technical occupations (6%)
Mexico (41%)
Guatemala (15%)
Brazil (7%)
Switzerland (6%)
Democratic Republic of Congo (Zaire) (4%)
Canada (3%)
Ecuador (2%)
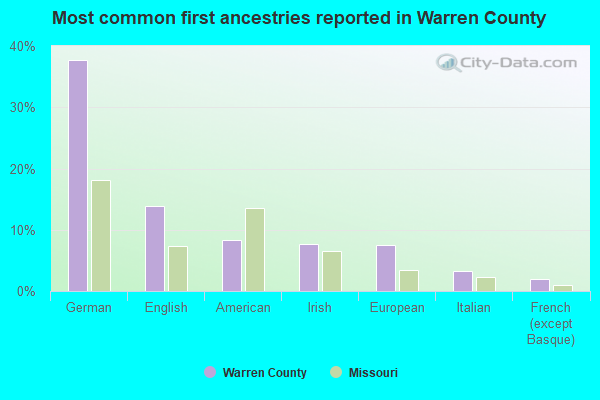
German (35%)
English (13%)
American (7%)
Irish (7%)
European (7%)
Italian (4%)
French (except Basque) (2%)
People in group quarters in Warren County, Missouri in 2010:
106 people in local jails and other municipal confinement facilities
79 people in group homes intended for adults
75 people in nursing facilities/skilled-nursing facilities
35 people in college/university student housing
12 people in residential treatment centers for juveniles (non-correctional)
10 people in workers' group living quarters and job corps centers
People in group quarters in Warren County, Missouri in 2000:
82 people in homes for the mentally retarded
73 people in nursing homes
56 people in local jails and other confinement facilities (including police lockups)
27 people in other group homes
23 people in other noninstitutional group quarters
9 people in other nonhousehold living situations
Average gross adjusted income of non-migrant taxpayers in this county in 2020 was $68,585.
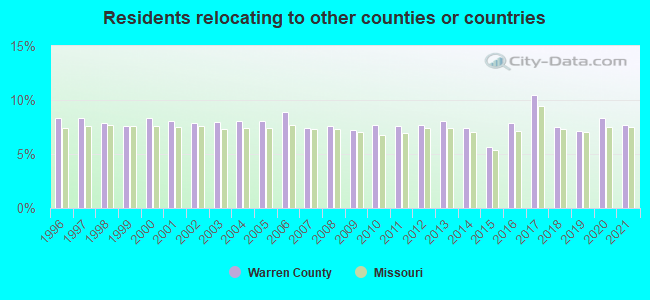
10.18% of this county's 2021 resident taxpayers lived in other counties in 2020 ($58,625 average adjusted gross income)
Here:
10.18%
Missouri average:
7.67%
10 or fewer of this county's residents moved from foreign countries.
8.40% relocated from other counties in Missouri ($47,370 average AGI)
1.77% relocated from other states ($11,255 average AGI)
Warren County:
1.77%
Missouri average:
3.04%
Top counties from which taxpayers relocated into this county between 2020 and 2021:
7.70% of this county's 2020 resident taxpayers moved to other counties in 2021 ($50,499 average adjusted gross income)
Here:
7.70%
Missouri average:
7.51%
10 or fewer of this county's residents moved to foreign countries.
6.40% relocated to other counties in Missouri ($41,079 average AGI)
1.31% relocated to other states ($9,420 average AGI)
Warren County:
1.31%
Missouri average:
2.88%
Top counties to which taxpayers relocated from this county between 2020 and 2021:
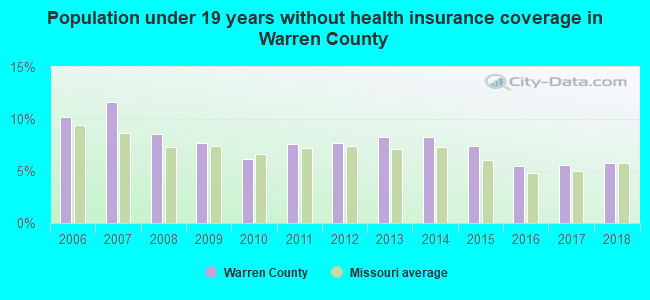
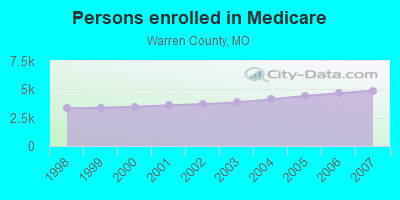
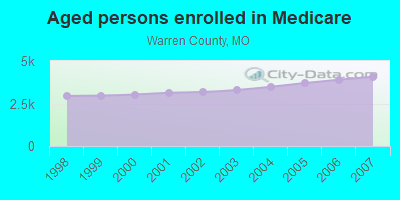
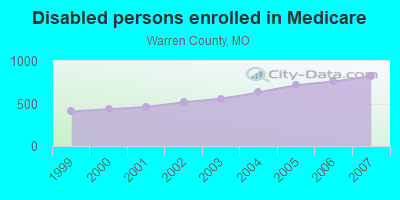
Persons enrolled in hospital insurance and/or supplemental medical insurance (Medicare) in July 1, 2007: 4,896 (4,076 aged, 820 disabled) Children under 18 without health insurance coverage in 2007: 915 (11%)
Most common underlying causes of death in Warren County, Missouri in 1999 - 2019:
Acute myocardial infarction, unspecified (591)
Bronchus or lung, unspecified - Malignant neoplasms (420)
Atherosclerotic cardiovascular disease, so described (32)
Stroke, not specified as haemorrhage or infarction (30)
Unspecified dementia (21)
Pancreas, unspecified - Malignant neoplasms (11)
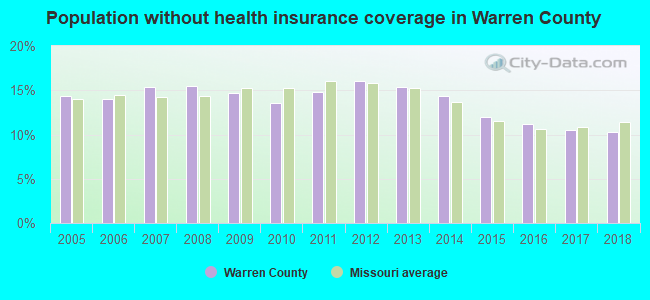
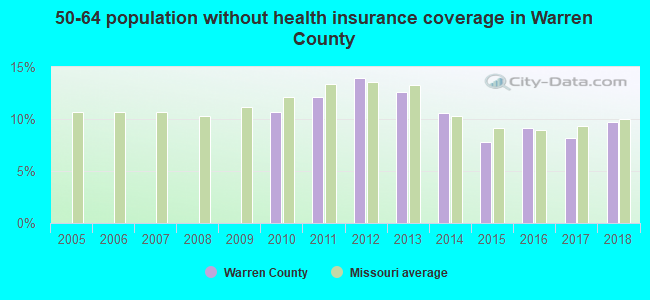
Population without health insurance coverage in 2000: 9% Children under 18 without health insurance coverage in 2000: 7%
General practice office based MDs per 100,000 population in 2005: 1,387 Medical specialist MDs per 100,000 population in 2005: 1,005 Dentists per 100,000 population in 1998: 3
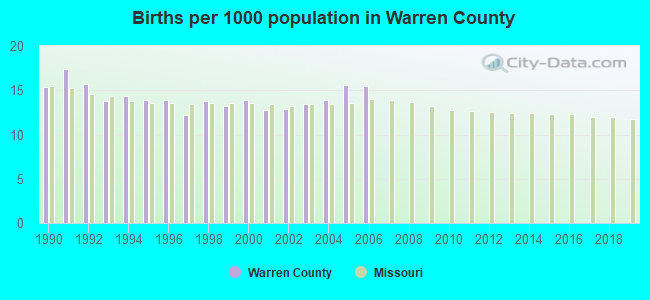
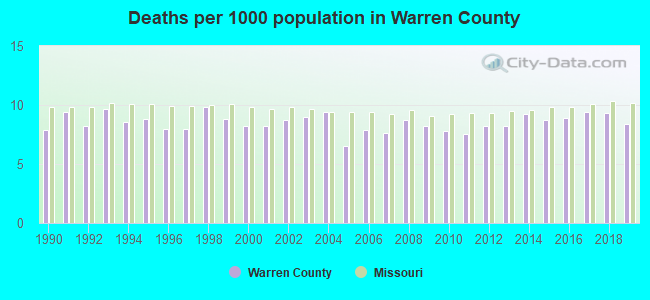
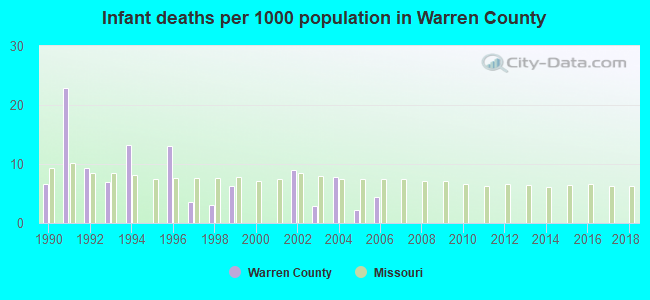
Total births per 100,000 population, July 2005 - July 2006 : 12 Total deaths per 100,000 population, July 2005 - July 2006: 52
Limited-service eating places per 100,000 population in 2005 : 7
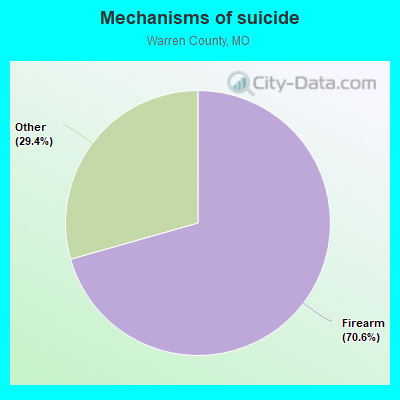
Suicides per 1,000,000 population from 2000 to 2006: 180.3. This is more than state average.
Deaths per 1,000,000 population:
Firearm - 127.3
Other - 53.0
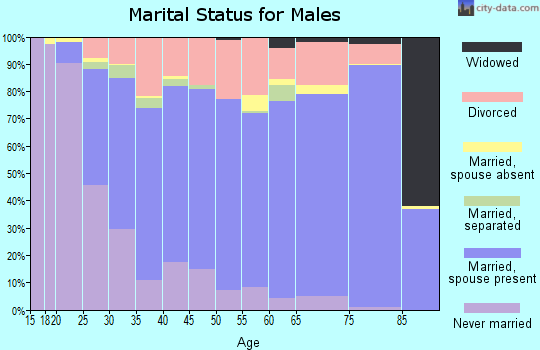
Household type by relationship:
Households: 36,632
Male householders: 7,140 (1,537 living alone), Female householders: 6,663 (1,361 living alone)
5,456 married couples with children.
1,693 single-parent households (704 men, 989 women).
96.4% of residents of Warren speak English at home.
2.4% of residents speak Spanish at home (54% speak English very well, 46% speak English well).
0.9% of residents speak other Indo-European language at home (69% speak English very well, 27% speak English well, 4% speak English not well).
0.1% of residents speak Asian or Pacific Island language at home (100% speak English very well).
In fiscal year 2004:
Federal Government expenditure: $107,419,000 ($3,863 per capita) Department of Defense expenditure: $3,402,000 Federal direct payments to individuals for retirement and disability: $59,577,000 Federal other direct payments to individuals: $26,791,000 Federal direct payments not to individuals: $2,334,000 Federal grants: $13,120,000 Federal procurement contracts: $1,627,000 ($732,000 Department of Defense) Federal salaries and wages: $3,970,000 ($430,000 Department of Defense) Federal Government direct loans: $419,000 Federal guaranteed/insured loans: $17,474,000 Federal Government insurance: $19,393,000
Population change from April 1, 2000 to July 1, 2005:
Births: 1,811
Here:
63 per 1000 residents
State:
69 per 1000 residents
Deaths: 1,182
Here:
41 per 1000 residents
State:
49 per 1000 residents
Net international migration: +59
Here:
+2 per 1000 residents
State:
+7 per 1000 residents
Net internal migration: +3,593
Here:
+125 per 1000 residents
State:
+5 per 1000 residents
Total withdrawal of fresh water for public supply: 2.24 millions of gallons per day (all from ground)
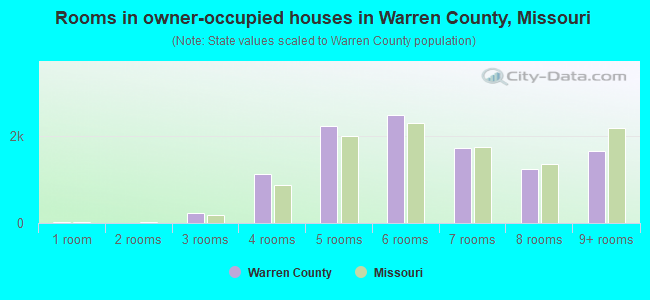
Median number of rooms in houses and condos:
Here:
6.1
State:
6.4
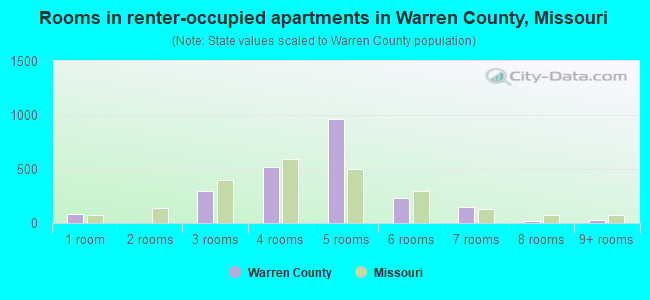
Median number of rooms in apartments:
Here:
4.6
State:
4.4
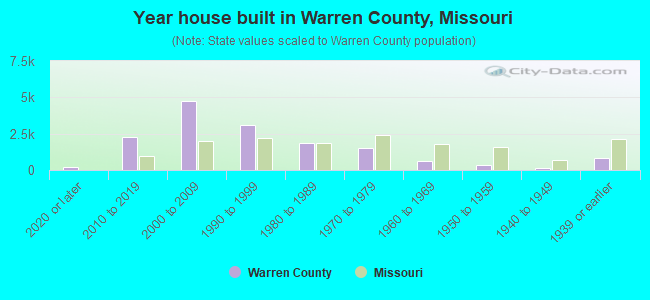
Year house built in Warren County, Missouri
6052020 or later
2,5502010 to 2019
4,1032000 to 2009
2,9191990 to 1999
2,1851980 to 1989
1,7351970 to 1979
6091960 to 1969
4111950 to 1959
921940 to 1949
8331939 or earlier
Rooms in houses/apartments in Warren County, Missouri
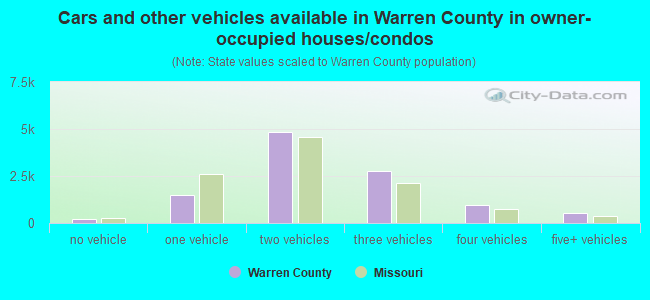
Cars and other vehicles available in Warren County in owner-occupied houses/condos
245no vehicle
1,5671 vehicle
5,1472 vehicles
2,9993 vehicles
9764 vehicles
5215+ vehicles
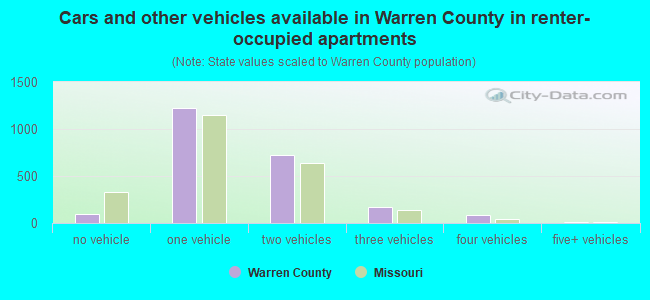
Cars and other vehicles available in Warren County in renter-occupied apartments
213no vehicle
1,2811 vehicle
6702 vehicles
1653 vehicles
374 vehicles
65+ vehicles
87.1% of Warren County residents lived in the same house 1 years ago. Out of people who lived in different houses, 24% lived in this county. Out of people who lived in different counties, 68% lived in Missouri.
Warren County:
87.1%
State average:
87.9%
Place of birth for U.S.-born residents:
This state: 28,181
Other state: 7,619
Northeast: 542
Midwest: 3,730
South: 1,931
West: 1,407
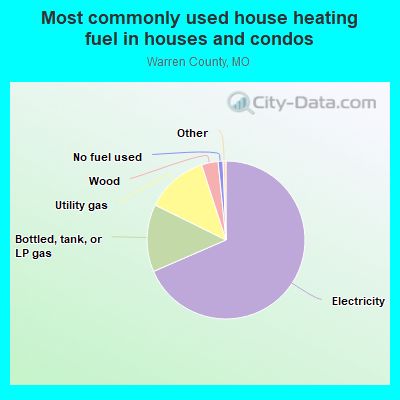
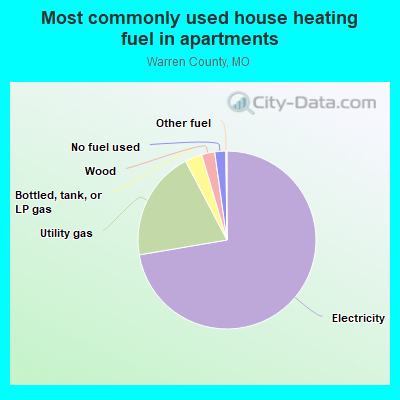
Most commonly used house heating fuel in Warren County
Note: This service is not intended for secure transactions such as banking, social media, email, or purchasing. Use at your own risk. We assume no liability whatsoever for broken pages.


 , Mineral County, Nevada
  , Jasper County, Illinois
  , Manassas Park city, Virginia