Work and Jobs in Hanover, Maine (ME) Detailed Stats
Occupations, Industries, Unemployment, Workers, Commute

Recent posts about work in Hanover, Maine on our local forum with over 2,400,000 registered users:
 | Demographics Dilemma in Maine (45 replies) |
| Best place for Healthcare and Higher Education: Portland or Portsmouth (4 replies) |
| Democratic vs. Republican, just out of curiosity (17 replies) |
| Why are you not moving to Maine? (95 replies) |
| Teaching in Maine (22 replies) |
| Rumford Maine (12 replies) |
Latest news about work in Hanover, ME collected exclusively by city-data.com from local newspapers, TV, and radio stations
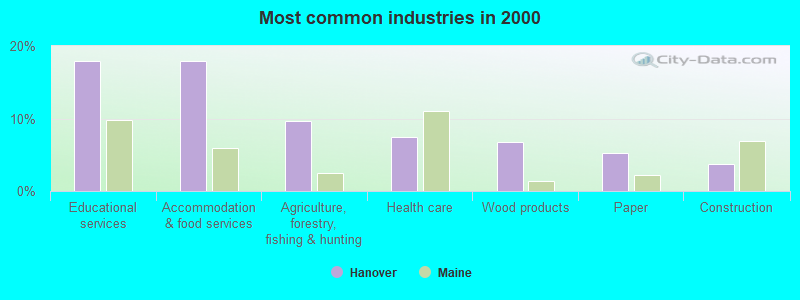
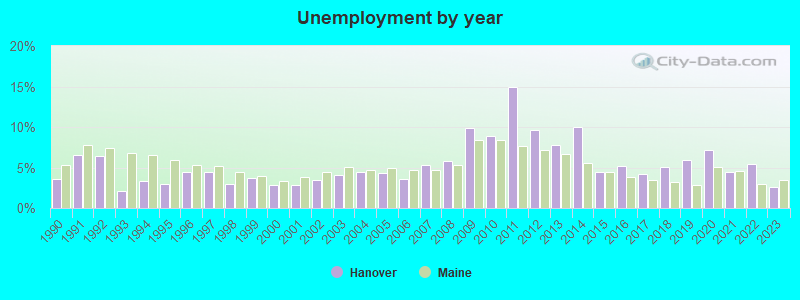
The unemployment rate in 2023 in Hanover, ME was 2.6%, which was 30.8% less than the unemployment rate of 3.4% across the entire state of Maine. Compared to the unemployment rate of 7.8% in 2013, this represents a decrease of 200.0%. The most common industries in Hanover are: Educational services (17.9% of civilian employees), Accommodation & food services (17.9% of civilian employees), Manufacturing (14.2% of civilian employees). 56.0% of workers are employees of private companies, which is 11.9% less than the rate of 62.7% across the entire state of Maine.
Most common industries
Most common industries | |||
|---|---|---|---|
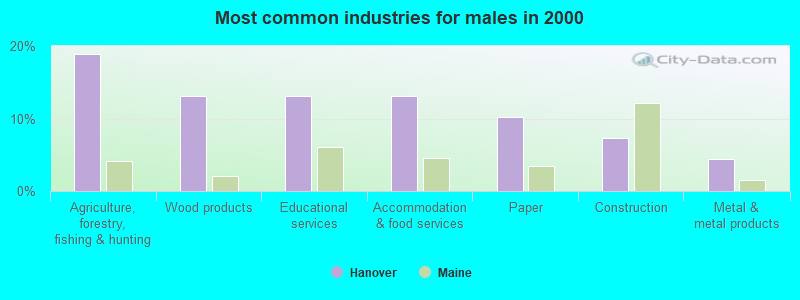
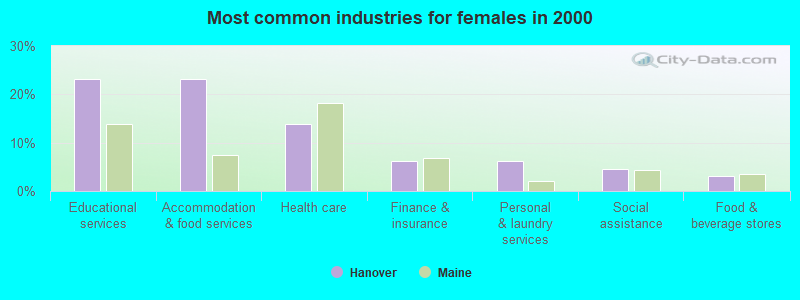
Industry | All | Males | Females |
| Educational services | 17.9% (24) | 13.0% (9) | 23.1% (15) |
| Accommodation and food services | 17.9% (24) | 13.0% (9) | 23.1% (15) |
| Manufacturing | 14.2% (19) | 27.5% (19) | 0.0% (0) |
| Agriculture, forestry, fishing and hunting | 9.7% (13) | 18.8% (13) | 0.0% (0) |
| Health care and social assistance | 9.7% (13) | 1.4% (1) | 18.5% (12) |
| Retail trade | 4.5% (6) | 5.8% (4) | 3.1% (2) |
| Construction | 3.7% (5) | 7.2% (5) | 0.0% (0) |
| Other services, except public administration | 3.7% (5) | 0.0% (0) | 7.7% (5) |
| Transportation and warehousing | 3.0% (4) | 0.0% (0) | 6.2% (4) |
| Information | 3.0% (4) | 2.9% (2) | 3.1% (2) |
| Finance and insurance | 3.0% (4) | 0.0% (0) | 6.2% (4) |
| Professional, scientific, and technical services | 3.0% (4) | 2.9% (2) | 3.1% (2) |
| Public administration | 3.0% (4) | 2.9% (2) | 3.1% (2) |
| Wholesale trade | 2.2% (3) | 4.3% (3) | 0.0% (0) |
| Real estate and rental and leasing | 1.5% (2) | 0.0% (0) | 3.1% (2) |
Unemployment in Hanover
- Unemployment by race in 2000
- Unemployment rate for White non-Hispanic residents
- 2.9%Males
Unemployment in 2023:
| Hanover: | 2.6% |
| Maine: | 3.4% |
Unemployment in 2022:
| Hanover: | 5.4% |
| Maine: | 3.0% |
Unemployment in 2021:
| Hanover: | 4.5% |
| Maine: | 4.6% |
Unemployment in 2020:
| Hanover: | 7.2% |
| Maine: | 5.1% |
Unemployment in 2019:
| Hanover: | 5.9% |
| Maine: | 2.9% |
Unemployment in 2018:
| Hanover: | 5.1% |
| Maine: | 3.2% |
Unemployment in 2017:
| Hanover: | 4.2% |
| Maine: | 3.4% |
Unemployment in 2016:
| Hanover: | 5.2% |
| Maine: | 3.8% |
Unemployment in 2015:
| Hanover: | 4.4% |
| Maine: | 4.4% |
Unemployment in 2014:
| Hanover: | 10.0% |
| Maine: | 5.6% |
Unemployment in 2013:
| Hanover: | 7.8% |
| Maine: | 6.7% |
Unemployment in 2012:
| Hanover: | 9.6% |
| Maine: | 7.2% |
Unemployment in 2011:
| Hanover: | 14.9% |
| Maine: | 7.7% |
Unemployment in 2010:
| Hanover: | 8.9% |
| Maine: | 8.4% |
Unemployment in 2009:
| Hanover: | 9.9% |
| Maine: | 8.4% |
Unemployment in 2008:
| Hanover: | 5.8% |
| Maine: | 5.3% |
Unemployment in 2007:
| Hanover: | 5.3% |
| Maine: | 4.7% |
Unemployment in 2006:
| Hanover: | 3.6% |
| Maine: | 4.7% |
Unemployment in 2005:
| Hanover: | 4.3% |
| Maine: | 4.9% |
Unemployment in 2004:
| Hanover: | 4.5% |
| Maine: | 4.7% |
Unemployment in 2003:
| Hanover: | 4.1% |
| Maine: | 5.1% |
Unemployment in 2002:
| Hanover: | 3.5% |
| Maine: | 4.5% |
Unemployment in 2001:
| Hanover: | 2.9% |
| Maine: | 3.8% |
Unemployment in 2000:
| Hanover: | 2.9% |
| Maine: | 3.3% |
Unemployment in 1999:
| Hanover: | 3.7% |
| Maine: | 4.0% |
Unemployment in 1998:
| Hanover: | 3.0% |
| Maine: | 4.5% |
Unemployment in 1997:
| Hanover: | 4.5% |
| Maine: | 5.2% |
Unemployment in 1996:
| Hanover: | 4.4% |
| Maine: | 5.3% |
Unemployment in 1995:
| Hanover: | 3.0% |
| Maine: | 5.9% |
Unemployment in 1994:
| Hanover: | 3.3% |
| Maine: | 6.6% |
Unemployment in 1993:
| Hanover: | 2.1% |
| Maine: | 6.8% |
Unemployment in 1992:
| Hanover: | 6.4% |
| Maine: | 7.4% |
Unemployment in 1991:
| Hanover: | 6.6% |
| Maine: | 7.8% |
Unemployment in 1990:
| Hanover: | 3.6% |
| Maine: | 5.3% |
Time leaving home to go to work

<5am:
| Hanover: | 6.0% (8) |
| Maine: | 4.4% (26,948) |
5:30am:
| Hanover: | 5.3% (7) |
| Maine: | 3.7% (22,592) |
6am:
| Hanover: | 8.3% (11) |
| Maine: | 5.2% (32,239) |
6:30am:
| Hanover: | 15.0% (20) |
| Maine: | 9.4% (57,835) |
7am:
| Hanover: | 5.3% (7) |
| Maine: | 11.5% (70,598) |
7:30am:
| Hanover: | 24.1% (32) |
| Maine: | 14.9% (91,521) |
8am:
| Hanover: | 15.0% (20) |
| Maine: | 14.4% (88,758) |
8:30am:
| Hanover: | 5.3% (7) |
| Maine: | 9.0% (55,154) |
10am:
| Hanover: | 2.3% (3) |
| Maine: | 3.8% (23,244) |
>4pm:
| Hanover: | 5.3% (7) |
| Maine: | 5.8% (35,860) |
Travel time to work


Less than 5 minutes:
| Hanover: | 7.5% (10) |
| Maine: | 5.6% (34,404) |
5 to 9 minutes:
| Hanover: | 1.5% (2) |
| Maine: | 14.1% (86,612) |
10 to 14 minutes:
| Hanover: | 18.0% (24) |
| Maine: | 16.0% (98,470) |
15 to 19 minutes:
| Hanover: | 24.1% (32) |
| Maine: | 14.9% (91,940) |
20 to 24 minutes:
| Hanover: | 11.3% (15) |
| Maine: | 13.1% (80,377) |
25 to 29 minutes:
| Hanover: | 9.0% (12) |
| Maine: | 5.1% (31,321) |
30 to 34 minutes:
| Hanover: | 3.0% (4) |
| Maine: | 10.4% (63,930) |
45 to 59 minutes:
| Hanover: | 9.0% (12) |
| Maine: | 5.6% (34,475) |
60 to 89 minutes:
| Hanover: | 4.5% (6) |
| Maine: | 3.6% (21,933) |
90 or more minutes:
| Hanover: | 3.8% (5) |
| Maine: | 2.3% (14,180) |
Means of transportation to work

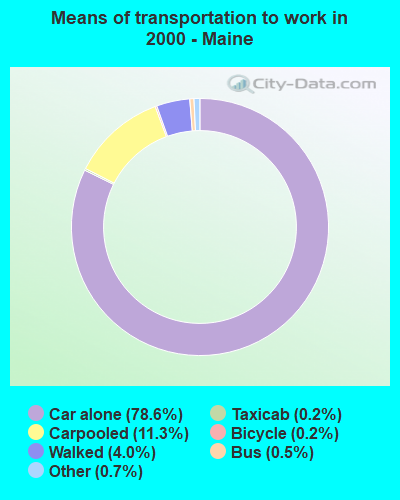
Drove car alone:
| Hanover: | 85.0% (113) |
| Maine: | 78.6% (483,317) |
Carpooled:
| Hanover: | 6.8% (9) |
| Maine: | 11.3% (69,208) |
Private vehicle occupancy

Drove alone:
| Hanover: | 92.6% (113) |
| Maine: | 87.5% (483,317) |
In 2 person carpool:
| Hanover: | 4.1% (5) |
| Maine: | 10.3% (56,707) |
In 4 person carpool:
| Hanover: | 3.3% (4) |
| Maine: | 0.3% (1,917) |
Class of workers

Employee of private company:
| Hanover: | 56.0% (75) |
| Maine: | 62.7% (390,945) |
Self-employed in own incorporated business:
| Hanover: | 3.7% (5) |
| Maine: | 3.1% (19,246) |
Private not-for-profit wage and salary workers:
| Hanover: | 6.7% (9) |
| Maine: | 10.2% (63,603) |
Local government workers:
| Hanover: | 11.2% (15) |
| Maine: | 7.6% (47,389) |
State government workers:
| Hanover: | 3.0% (4) |
| Maine: | 4.3% (26,534) |
Federal government workers:
| Hanover: | 3.0% (4) |
| Maine: | 2.6% (16,465) |
Self-employed workers in own not incorporated business:
| Hanover: | 16.4% (22) |
| Maine: | 9.3% (58,153) |

Employee of private company - Males:
| Hanover: | 55.1% (38) |
| Maine: | 65.6% (212,697) |
Self-employed in own incorporated business - Males:
| Hanover: | 7.2% (5) |
| Maine: | 4.3% (14,069) |
Local government workers - Males:
| Hanover: | 10.1% (7) |
| Maine: | 5.6% (18,289) |
State government workers - Males:
| Hanover: | 5.8% (4) |
| Maine: | 3.8% (12,314) |
Self-employed workers in own not incorporated business - Males:
| Hanover: | 21.7% (15) |
| Maine: | 11.3% (36,757) |

Employee of private company - Females:
| Hanover: | 56.9% (37) |
| Maine: | 59.5% (178,248) |
Private not-for-profit wage and salary workers - Females:
| Hanover: | 13.8% (9) |
| Maine: | 14.7% (44,130) |
Local government workers - Females:
| Hanover: | 12.3% (8) |
| Maine: | 9.7% (29,100) |
Federal government workers - Females:
| Hanover: | 6.2% (4) |
| Maine: | 2.2% (6,505) |
Self-employed workers in own not incorporated business - Females:
| Hanover: | 10.8% (7) |
| Maine: | 7.1% (21,396) |