Work and Jobs in New Virginia, Iowa (IA) Detailed Stats
Occupations, Industries, Unemployment, Workers, Commute
Settings
X


Discuss New Virginia, Iowa work on our local forum with over 2,400,000 registered users
According to 2023 data, the most common industries in New Virginia are: Retail trade (13.0% of civilian employees), Construction (12.5% of civilian employees), Finance & insurance (11.7% of civilian employees). 34.2% of workers work in Warren County and 13.6% of all workers work at home. 73.7% of workers are employees of private companies, which is 10.1% greater than the rate of 66.2% across the entire state of Iowa.
Whole page based on the data from 2000 / 2023 when the population of New Virginia, Iowa was 469 / 515
Whole page based on the data from 2000 / 2023 when the population of New Virginia, Iowa was 469 / 515
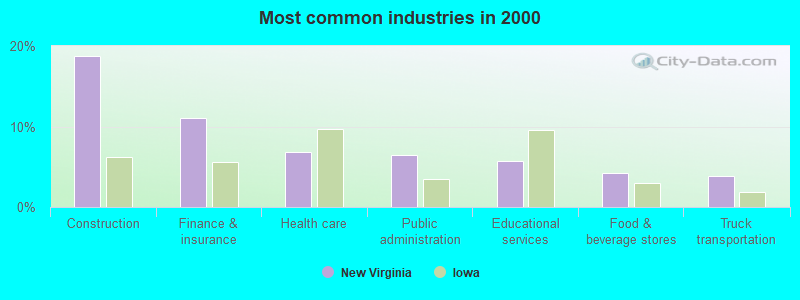
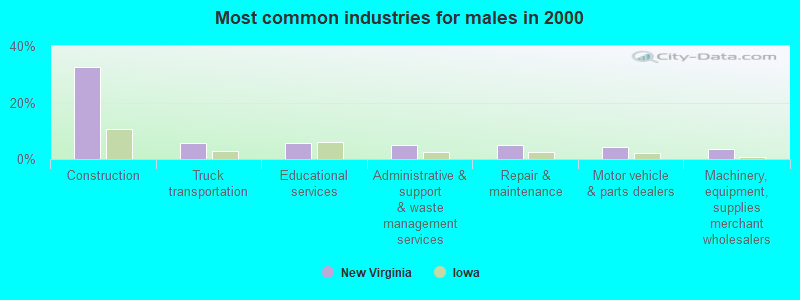
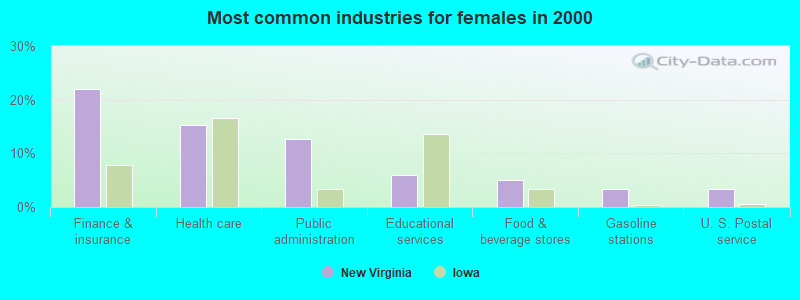
Most common industries


Most common industries | Most common industries | |||||
|---|---|---|---|---|---|---|
Industry | All | Males | Females | All | Males | Females |
| Retail trade | 13.0% (30) | 19.1% (24) | 5.7% (6) | 11.1% (29) | 11.8% (17) | 10.2% (12) |
| Construction | 12.5% (29) | 23.0% (29) | 0.0% (0) | 18.7% (49) | 32.6% (47) | 1.7% (2) |
| Finance and insurance | 11.7% (27) | 4.8% (6) | 19.9% (21) | 11.1% (29) | 2.1% (3) | 22.0% (26) |
| Manufacturing | 10.8% (25) | 14.3% (18) | 6.6% (7) | 7.6% (20) | 10.4% (15) | 4.2% (5) |
| Educational services | 10.8% (25) | 1.6% (2) | 21.8% (23) | 5.7% (15) | 5.6% (8) | 5.9% (7) |
| Health care and social assistance | 7.8% (18) | 0.0% (0) | 17.0% (18) | 6.9% (18) | 0.0% (0) | 15.3% (18) |
| Public administration | 7.3% (17) | 7.1% (9) | 7.6% (8) | 6.5% (17) | 1.4% (2) | 12.7% (15) |
| Transportation and warehousing | 6.0% (14) | 11.1% (14) | 0.0% (0) | 6.1% (16) | 6.9% (10) | 5.1% (6) |
| Other services, except public administration | 4.8% (11) | 4.0% (5) | 5.7% (6) | 5.0% (13) | 6.2% (9) | 3.4% (4) |
| Professional, scientific, and technical services | 4.3% (10) | 7.9% (10) | 0.0% (0) | 1.5% (4) | 1.4% (2) | 1.7% (2) |
| Arts, entertainment, and recreation | 3.9% (9) | 4.0% (5) | 3.8% (4) | 0.8% (2) | 0.0% (0) | 1.7% (2) |
| Agriculture, forestry, fishing and hunting | 1.3% (3) | 0.0% (0) | 2.8% (3) | 0.8% (2) | 0.0% (0) | 1.7% (2) |
| Wholesale trade | 1.3% (3) | 0.0% (0) | 2.8% (3) | 6.1% (16) | 9.7% (14) | 1.7% (2) |
| Accommodation and food services | 1.3% (3) | 0.0% (0) | 2.8% (3) | 1.5% (4) | 1.4% (2) | 1.7% (2) |
| Utilities | 0.9% (2) | 1.6% (2) | 0.0% (0) | 1.1% (3) | 0.0% (0) | 2.5% (3) |
| Real estate and rental and leasing | 0.9% (2) | 0.0% (0) | 1.9% (2) | 2.3% (6) | 2.1% (3) | 2.5% (3) |
| Information | 0.0% (0) | 0.0% (0) | 0.0% (0) | 3.8% (10) | 3.5% (5) | 4.2% (5) |
| Administrative and support and waste management services | 0.0% (0) | 0.0% (0) | 0.0% (0) | 3.4% (9) | 4.9% (7) | 1.7% (2) |
Unemployment in New Virginia
- Unemployment by race in 2000
- Unemployment rate for White non-Hispanic residents
- 4.0%Males
- 4.1%Females
Time leaving home to go to work

12:00 a.m. to 4:59 a.m.:
| New Virginia: | 7.2% (14) |
| Iowa: | 5.1% (73,771) |
5:00 a.m. to 5:29 a.m.:
| New Virginia: | 13.6% (27) |
| Iowa: | 4.1% (59,240) |
5:30 a.m. to 5:59 a.m.:
| New Virginia: | 5.6% (11) |
| Iowa: | 5.8% (83,860) |
6:00 a.m. to 6:29 a.m.:
| New Virginia: | 8.3% (17) |
| Iowa: | 8.4% (123,030) |
6:30 a.m. to 6:59 a.m.:
| New Virginia: | 18.3% (37) |
| Iowa: | 11.1% (161,378) |
7:00 a.m. to 7:29 a.m.:
| New Virginia: | 10.9% (22) |
| Iowa: | 15.5% (225,257) |
7:30 a.m. to 7:59 a.m.:
| New Virginia: | 11.0% (22) |
| Iowa: | 15.4% (225,171) |
8:00 a.m. to 8:29 a.m.:
| New Virginia: | 1.5% (3) |
| Iowa: | 8.9% (130,211) |
12:00 p.m. to 3:59 p.m.:
| New Virginia: | 5.2% (10) |
| Iowa: | 7.1% (103,391) |
4:00 p.m. to 11:59 p.m.:
| New Virginia: | 18.4% (37) |
| Iowa: | 7.0% (102,512) |

<5am:
| New Virginia: | 3.1% (8) |
| Iowa: | 3.2% (47,736) |
5:30am:
| New Virginia: | 4.7% (12) |
| Iowa: | 2.9% (42,797) |
6am:
| New Virginia: | 9.4% (24) |
| Iowa: | 4.6% (68,195) |
6:30am:
| New Virginia: | 10.2% (26) |
| Iowa: | 7.5% (110,529) |
7am:
| New Virginia: | 25.4% (65) |
| Iowa: | 11.2% (164,470) |
7:30am:
| New Virginia: | 9.0% (23) |
| Iowa: | 14.2% (208,547) |
8am:
| New Virginia: | 13.3% (34) |
| Iowa: | 17.7% (260,172) |
8:30am:
| New Virginia: | 7.8% (20) |
| Iowa: | 8.3% (121,843) |
9am:
| New Virginia: | 0.8% (2) |
| Iowa: | 3.6% (53,363) |
10am:
| New Virginia: | 4.3% (11) |
| Iowa: | 3.6% (53,533) |
4pm:
| New Virginia: | 7.0% (18) |
| Iowa: | 8.0% (117,038) |
>4pm:
| New Virginia: | 3.5% (9) |
| Iowa: | 7.7% (112,601) |

5:00 a.m. to 5:29 a.m. - Males:
| New Virginia: | 16.3% (18) |
| Iowa: | 5.1% (39,266) |
5:30 a.m. to 5:59 a.m. - Males:
| New Virginia: | 10.3% (11) |
| Iowa: | 6.9% (53,012) |
6:00 a.m. to 6:29 a.m. - Males:
| New Virginia: | 11.8% (13) |
| Iowa: | 10.4% (80,668) |
6:30 a.m. to 6:59 a.m. - Males:
| New Virginia: | 24.3% (27) |
| Iowa: | 11.9% (92,256) |
7:30 a.m. to 7:59 a.m. - Males:
| New Virginia: | 9.0% (10) |
| Iowa: | 12.4% (95,978) |
8:00 a.m. to 8:29 a.m. - Males:
| New Virginia: | 0.9% (1) |
| Iowa: | 8.3% (64,461) |
12:00 p.m. to 3:59 p.m. - Males:
| New Virginia: | 3.5% (4) |
| Iowa: | 6.9% (53,346) |
4:00 p.m. to 11:59 p.m. - Males:
| New Virginia: | 24.1% (26) |
| Iowa: | 7.5% (57,666) |

12:00 a.m. to 4:59 a.m. - Females:
| New Virginia: | 17.8% (16) |
| Iowa: | 3.7% (25,227) |
5:00 a.m. to 5:29 a.m. - Females:
| New Virginia: | 10.4% (9) |
| Iowa: | 2.9% (19,974) |
6:00 a.m. to 6:29 a.m. - Females:
| New Virginia: | 4.3% (4) |
| Iowa: | 6.2% (42,362) |
6:30 a.m. to 6:59 a.m. - Females:
| New Virginia: | 10.4% (9) |
| Iowa: | 10.1% (69,122) |
7:00 a.m. to 7:29 a.m. - Females:
| New Virginia: | 24.0% (22) |
| Iowa: | 16.2% (111,065) |
7:30 a.m. to 7:59 a.m. - Females:
| New Virginia: | 13.5% (12) |
| Iowa: | 18.9% (129,193) |
8:00 a.m. to 8:29 a.m. - Females:
| New Virginia: | 2.2% (2) |
| Iowa: | 9.6% (65,750) |
12:00 p.m. to 3:59 p.m. - Females:
| New Virginia: | 7.3% (7) |
| Iowa: | 7.3% (50,045) |
4:00 p.m. to 11:59 p.m. - Females:
| New Virginia: | 12.0% (11) |
| Iowa: | 6.6% (44,846) |
Travel time to work
Percentage of workers working in this county: 34.2%
Number of people working at home: 31 (13.6% of all workers)
Number of people working at home: 31 (13.6% of all workers)


5 to 9 minutes:
| New Virginia: | 7.0% (18) |
| Iowa: | 18.5% (271,589) |
10 to 14 minutes:
| New Virginia: | 8.6% (22) |
| Iowa: | 19.3% (283,804) |
15 to 19 minutes:
| New Virginia: | 9.0% (23) |
| Iowa: | 16.0% (234,745) |
20 to 24 minutes:
| New Virginia: | 5.1% (13) |
| Iowa: | 12.5% (183,539) |
25 to 29 minutes:
| New Virginia: | 3.9% (10) |
| Iowa: | 4.6% (67,775) |
30 to 34 minutes:
| New Virginia: | 9.0% (23) |
| Iowa: | 7.6% (111,454) |
35 to 39 minutes:
| New Virginia: | 4.3% (11) |
| Iowa: | 1.5% (22,220) |
40 to 44 minutes:
| New Virginia: | 17.6% (45) |
| Iowa: | 1.7% (24,880) |
45 to 59 minutes:
| New Virginia: | 25.0% (64) |
| Iowa: | 3.4% (49,913) |
60 to 89 minutes:
| New Virginia: | 7.0% (18) |
| Iowa: | 2.0% (28,703) |
90 or more minutes:
| New Virginia: | 2.0% (5) |
| Iowa: | 1.4% (20,741) |
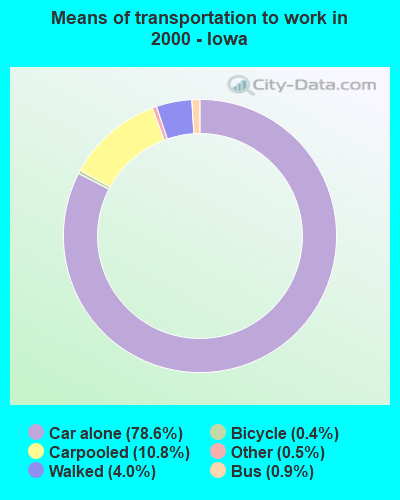
Means of transportation to work

Drove car alone:
| New Virginia: | 69.5% (178) |
| Iowa: | 78.6% (1,155,008) |
Carpooled:
| New Virginia: | 25.4% (65) |
| Iowa: | 10.8% (158,699) |
Walked:
| New Virginia: | 3.5% (9) |
| Iowa: | 4.0% (58,088) |
Private vehicle occupancy

Drove alone:
| New Virginia: | 86.9% (169) |
| Iowa: | 90.3% (1,241,020) |
In 2 person carpool:
| New Virginia: | 13.1% (25) |
| Iowa: | 7.3% (100,340) |

Drove alone:
| New Virginia: | 73.3% (178) |
| Iowa: | 87.9% (1,155,008) |
In 2 person carpool:
| New Virginia: | 22.6% (55) |
| Iowa: | 9.8% (128,891) |
In 3 person carpool:
| New Virginia: | 2.1% (5) |
| Iowa: | 1.4% (18,510) |
In 4 person carpool:
| New Virginia: | 2.1% (5) |
| Iowa: | 0.5% (6,602) |
Class of workers

Employee of private company:
| New Virginia: | 73.7% (171) |
| Iowa: | 66.2% (1,095,771) |
Private not-for-profit wage and salary workers:
| New Virginia: | 2.6% (6) |
| Iowa: | 8.7% (144,397) |
Local government workers:
| New Virginia: | 8.8% (20) |
| Iowa: | 7.7% (128,087) |
State government workers:
| New Virginia: | 8.3% (19) |
| Iowa: | 5.1% (84,862) |
Federal government workers:
| New Virginia: | 2.6% (6) |
| Iowa: | 1.9% (31,702) |
Self-employed workers in own not incorporated business:
| New Virginia: | 3.9% (9) |
| Iowa: | 6.4% (106,068) |

Employee of private company:
| New Virginia: | 64.1% (168) |
| Iowa: | 66.6% (992,122) |
Private not-for-profit wage and salary workers:
| New Virginia: | 8.4% (22) |
| Iowa: | 8.2% (121,940) |
Local government workers:
| New Virginia: | 6.5% (17) |
| Iowa: | 6.1% (90,430) |
State government workers:
| New Virginia: | 6.1% (16) |
| Iowa: | 5.8% (85,726) |
Federal government workers:
| New Virginia: | 2.3% (6) |
| Iowa: | 1.8% (27,176) |
Self-employed workers in own not incorporated business:
| New Virginia: | 11.5% (30) |
| Iowa: | 8.2% (121,579) |
Unpaid family workers:
| New Virginia: | 1.1% (3) |
| Iowa: | 0.4% (6,513) |

Employee of private company - Males:
| New Virginia: | 83.1% (105) |
| Iowa: | 70.8% (611,631) |
Local government workers - Males:
| New Virginia: | 4.8% (6) |
| Iowa: | 5.3% (45,845) |
State government workers - Males:
| New Virginia: | 1.6% (2) |
| Iowa: | 4.3% (37,539) |
Federal government workers - Males:
| New Virginia: | 4.8% (6) |
| Iowa: | 1.9% (16,496) |
Self-employed workers in own not incorporated business - Males:
| New Virginia: | 5.6% (7) |
| Iowa: | 7.7% (66,349) |

Employee of private company - Females:
| New Virginia: | 62.5% (66) |
| Iowa: | 61.3% (484,140) |
Private not-for-profit wage and salary workers - Females:
| New Virginia: | 5.8% (6) |
| Iowa: | 12.9% (102,327) |
Local government workers - Females:
| New Virginia: | 13.5% (14) |
| Iowa: | 10.4% (82,242) |
State government workers - Females:
| New Virginia: | 16.3% (17) |
| Iowa: | 6.0% (47,323) |
Self-employed workers in own not incorporated business - Females:
| New Virginia: | 1.9% (2) |
| Iowa: | 5.0% (39,719) |