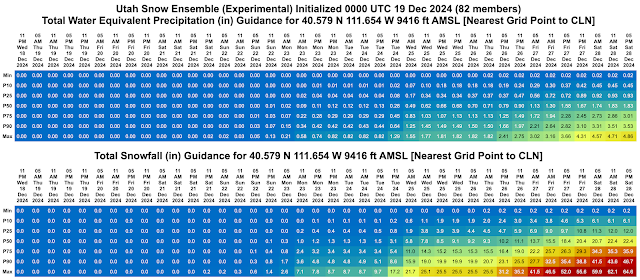
By popular demand, we now have a tabular output product from the Utah Snow Ensemble for Alta-Collins available at https://weather.utah.edu/text/ensgefsdslccforecast.html. This should provide access to the most recently processed run and provides tables of total water equivalent precipitation, total snowfall, 6-h water equivalent precipitation, 6-h snowfall, snow-to-liquid ratio, and wet-bulb 0.5C height. Times are local (mountain) time. Cells are color filled by magnitude. An example of the first two tables is below.
The row labeling for each table goes from the minimum value of the 82 ensemble members to the maximum value. The P stand for "Percentile" so that P10 means the 10th percentile. That means that 10% of the ensemble members are below that amount and 90% are above it.
P50 thus is right in the middle, or what statistical types call the median. 50% of the members lie between P25 and P75 (this was corrected from a typo that said P50 incorrectly), or what statistical types call the interquartile range. If you want to get an idea of what the range of the middle of the forecasts is, these are the rows to use.
This is a lot to stick on a web page, so you may need to get used to zooming in and out and scrolling up and down. I don't have time to program a proper web site so you get what you get and don't throw a fit. At least that's what my mother told me.
The table above is from last night's 0000 UTC forecast cycle. We are finally starting to see some hope of a bit of storminess during the holiday period, with median snowfall at 22.4" by 5 PM Saturday 28 December. That sets the over-under. Are you betting over or under?


