Basic Configuration Environment for Apache kafka Metrics and monitoring.
Apache kafka Cluster Configuration with Metrics Visualization using JMX Exporter Agent, Connection and monitoring Prometheus, Grafana and Conduktor in Docker Containers.
Make sure you have the latest versions of Docker and Docker Compose installed on your machine.
Clone this repository or copy the files from this repository into a new folder. In the docker-compose.yml file, you can change the ports (in case you're running multiple containers on your system).
With this project, you can quickly run the following:
Contents:
Edit the .env file to change the default environment variables.
Open a terminal and run cd to the folder where you can see the files docker-compose-single-config.yml, which contains the necessary configuration to deploy a Kafka broker, and the file docker-compose-multiple-config.yml, which contains the configuration for multiple Apache Kafka brokers.
Execute as needed:
docker-compose -f docker-compose-single-config.yml up -d
This will start the containers and create volumes according to the configuration in your docker-compose.yml files. Make sure to grant write permissions to the directory so it can create the necessary volumes for the containers. Similarly, remember to clean the volumes folder when running different files to avoid data inconsistency.
.env– File containing the environment variable data.volumenes– Folder containing container data.config– Folder containing the configuration files necessary for the operation of the containers.
The containers are already built and running. You should be able to access the installation of each container.
You can visit http:/localhost:9090 to access Prometheus after starting the containers, and you will see a screen like the following, where you will have the option to add panels based on your custom query.

In the Status menu, you can see the status of your Apache kafka broker under targets.

You can visit http:/localhost:3000 to access Grafana. The default username is admin, which is provided in the .env file, and the password is admin. Once you log in, it will prompt you to create a new password.

Once logged in, you will see a screen like the following:

Where you will need to add your Prometheus data source as shown in the image.

You will select Prometheus as your data source.

You will need to fill in the connection details for your Prometheus container.
To add a new dashboard to Grafana, select New, followed by Import, where you will choose the dashboard-kafka.json file located in the config folder, which is configured for the visualization of Kafka metrics.

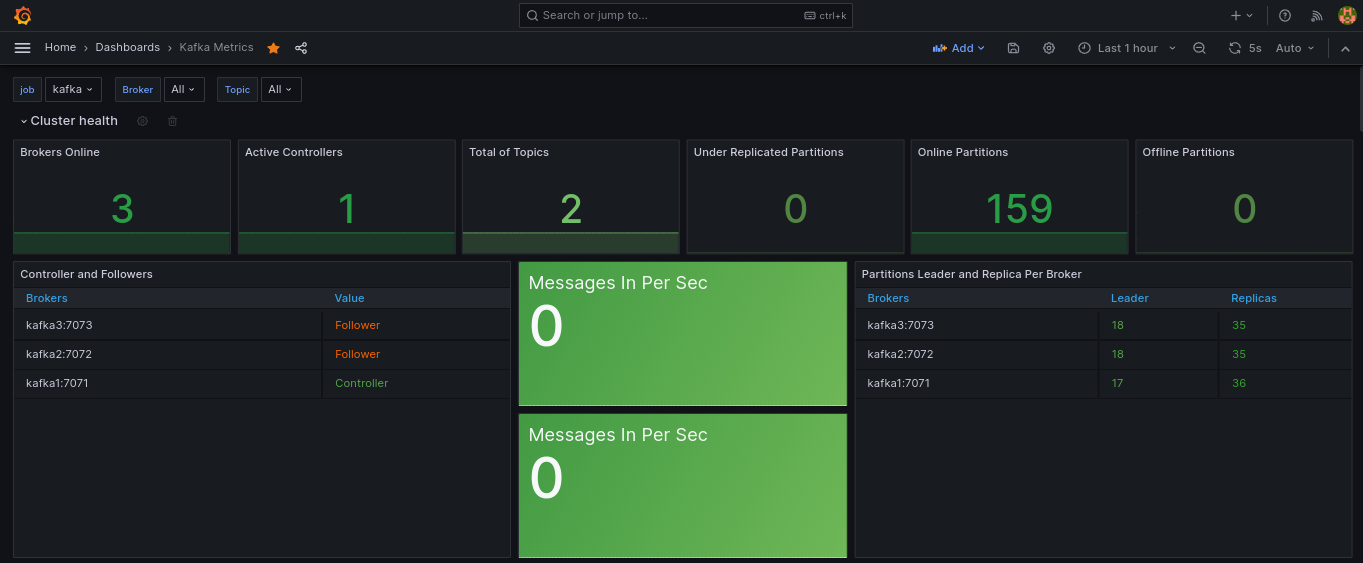
Once the file is imported, you will obtain the following screens with multiple panels and graphs representing the metrics of the Apache Kafka cluster and brokers.


You can visit http:/localhost:8080 to access Conduktor. The default username is admin@admin.io, and the password is admin. You can modify these credentials in the environment variables located in the .env file.

The Conduktor tool will allow you to view the status of the cluster as well as visualize the Apache Kafka brokers you have deployed.


Conduktor will be useful for conducting the necessary tests and visually managing Apache Kafka. You will be able to create new topics and send/consume messages.


