. Author manuscript; available in PMC: 2008 Apr 30.
Published in final edited form as: Psychopharmacology (Berl). 2007 Jul 22;195(1):71–84. doi: 10.1007/s00213-007-0882-0

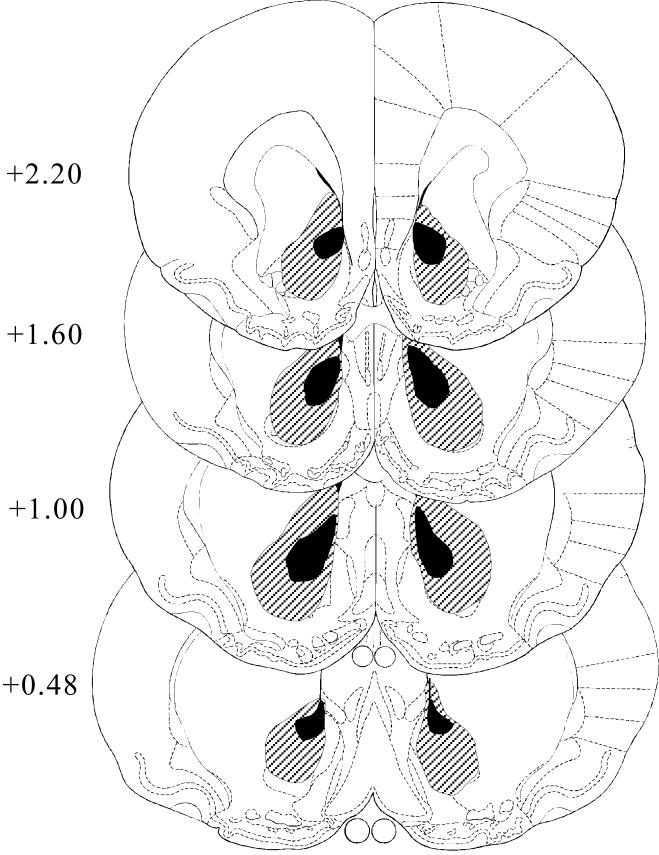
Figure 7.

Figure 7

Diagram of approximate area of destruction of the AcbC in the lesioned group. Drawings were made from the microscopic sections, superimposed on the relevant pages of Paxinos and Watson’s (1998) stereotaxic atlas. Locations of the sections in the AP plane (mm anterior to bregma) are indicated on the left. The black area represents the smallest and the shaded area the largest lesion.
pFad - Phonifier reborn

Pfad - The Proxy pFad of © 2024 Garber Painting. All rights reserved.

Note: This service is not intended for secure transactions such as banking, social media, email, or purchasing. Use at your own risk. We assume no liability whatsoever for broken pages.


Alternative Proxies:

Alternative Proxy

pFad Proxy

pFad v3 Proxy

pFad v4 Proxy