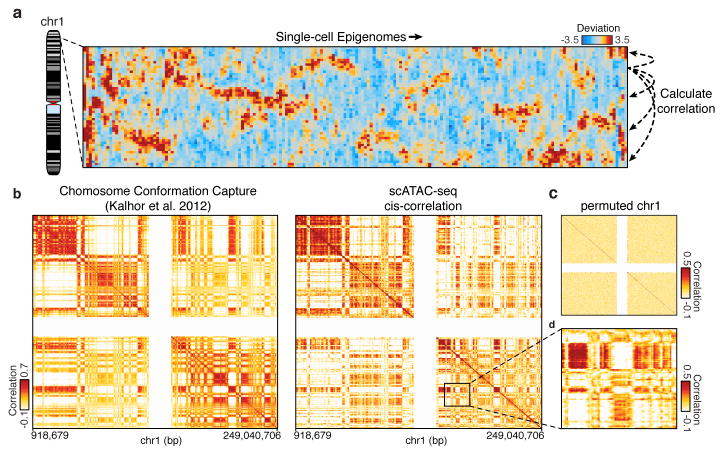
Figure 4. Structured cis variability across single epigenomes.
(a) Per-cell deviations of expected fragments across a region within chromosome 1 (see Methods). For display, only large deviation cells are shown (N=186 cells). (b) Pearson correlation coefficient representing topological domain signal (see Methods) of interaction frequency from a chromatin conformation capture assay (left, data from Kalhor et al.29) or doubly correlated normalized deviations of scATAC-seq (right) from chromosome 1 (see Methods). Data in white represents masked regions due to highly repetitive regions. (c) Permuted cis-correlation map for chromosome 1 (analyzed identically to (b)). (d) Box highlights a representative region depicting long-range covariability.
