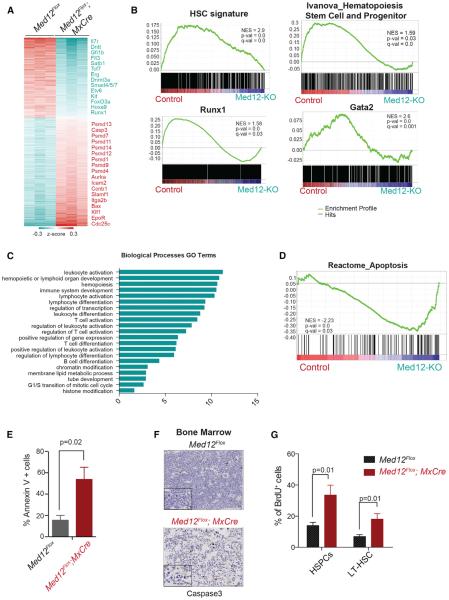
Figure 4. MED12 Deletion Causes Loss of HSC Signatures and Increased Rates of Apoptosis.
(A) Differentially expressed genes (fold change >1.5, false discovery rate [FDR] p value < 0.05) between Med12Flox;Mx-Cre and Med12Flox HSPCs 4 days after pI:pC are shown.
(B) HSC and key hematopoietic transcription factor gene signatures are decreased upon MED12 deletion, as determined by GSEA.
(C) Biological function annotation of downregulated genes in MED12-deficient HSPCs, using The Database for Annotation, Visualization and Integrated Discovery (DAVID) (Huang da et al., 2009), is shown.
(D) Representative apoptosis signature identified by GSEA enriched in MED12-deficient cells is shown.
(E) Annexin V staining in indicated mice 4 days after pI:pC is shown.
(F) Cleaved caspase-3 immunohistochemistry in bone marrow of Med12Flox;Mx-Cre and Med12Flox mice 10 days after pI:pC. Lower panel shows higher magnification.
(G) In vivo BrdU+ labeling of LT-HSCs (Lineage−, c-Kit+, Sca-1+, CD150+, and CD48−) and HSPCs (Lineage, c-Kit+, and Sca-1+) is shown. Scale bars, 100 and 10 μm.
Data represent mean ± SD; p values were determined with two-tailed Student's t tests. See also Figure S4 and Table S5.
