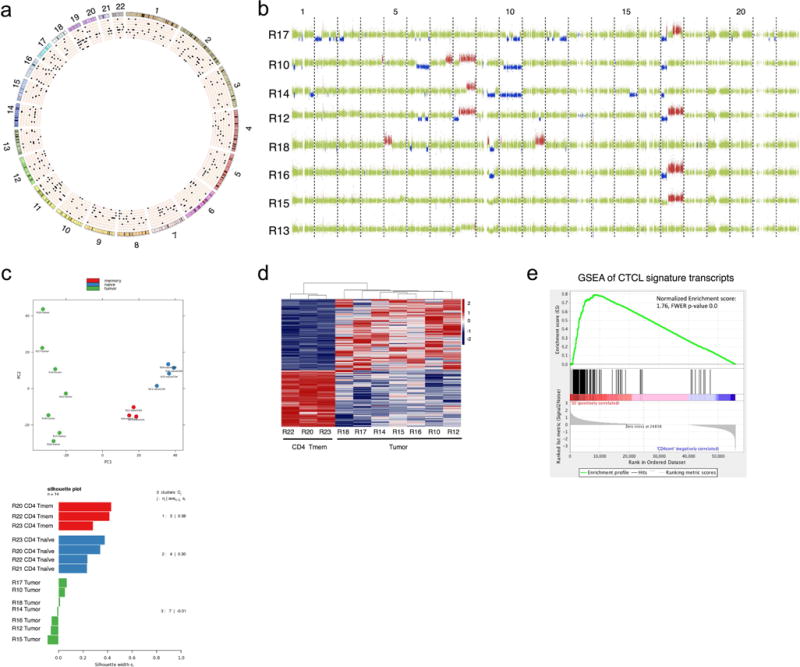
Fig. 1. Genetic landscape of CTCL.

(a) Circos plot of SNVs identified by WES. Mutations were identified by comparing the tumor cells with patient’s B cells. Individual chromosomes are marked on the outer ring. Concentric circles represent patient genomes. Black pips indicate deleterious SNVs filtered for coverage >14 reads and predicted deleteriousness score of >0.5 by PolyPhen-2. 8 patient biospecimens are ordered from outside-in by decreasing tumor burden. (b) Copy number gains (red) and losses (blue) detected in SS genomes. Green indicates normal copy number. Each row represents analysis from an individual patient with samples ordered by decreasing tumor burden. (c) PCA plot (top) and silhouette analysis (bottom) of RNAseq data from 7 SS samples, and Tnaïve and Tmemory cells from healthy individuals. (d) Heat map displaying differential gene expression of malignant T cells (tumor) to memory T cells (memCD4), genes displayed have q value ≤ 0.05 (e) GSEA analysis performed on published transcriptome of sorted T cells from SS patients and healthy individuals using our CTCL gene signature.