National Land Cover Database on SheltoweeTrace.com

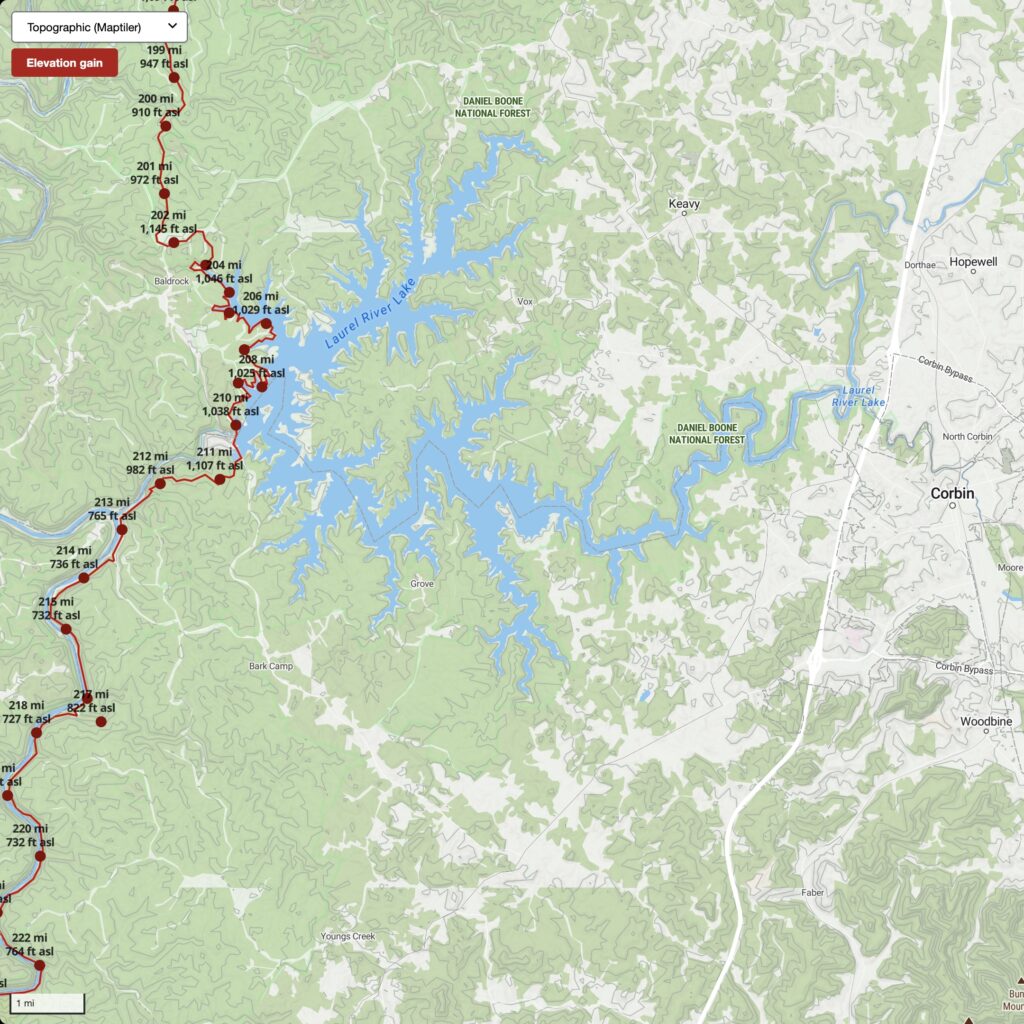
Two new layers have been added to the web map for the Daniel Boone NF and Big South Fork NRRA: the National Land Cover Database (NLCD) for 2021 (mrlc.gov) and mined lands, 1985–2020 (skytruth.org). The NLCD is a 30-meter resolution (each cell is 30×30 meters) land cover dataset showing each cell’s dominant land use.

Screenshot of land cover map at SheltoweeTrace.com
Screenshot of the land cover map at SheltoweeTrace.com

The cells are symbolized to show features significant for the area, such as multiple types of vegetation cover, the density of the built environment, and barren land. Inside the NF and NPS boundaries, barren land is likely to be exposures of bedrock, boulders, and earthen materials. For example, it shows Cumberland Falls. Outside of these boundaries, barren land is likely mines or construction sites.

While the layer is low-resolution compared to the aerial photography layer, the NLCD helps us quickly understand landscape conditions that would be tedious to interpret from aerial photography alone.
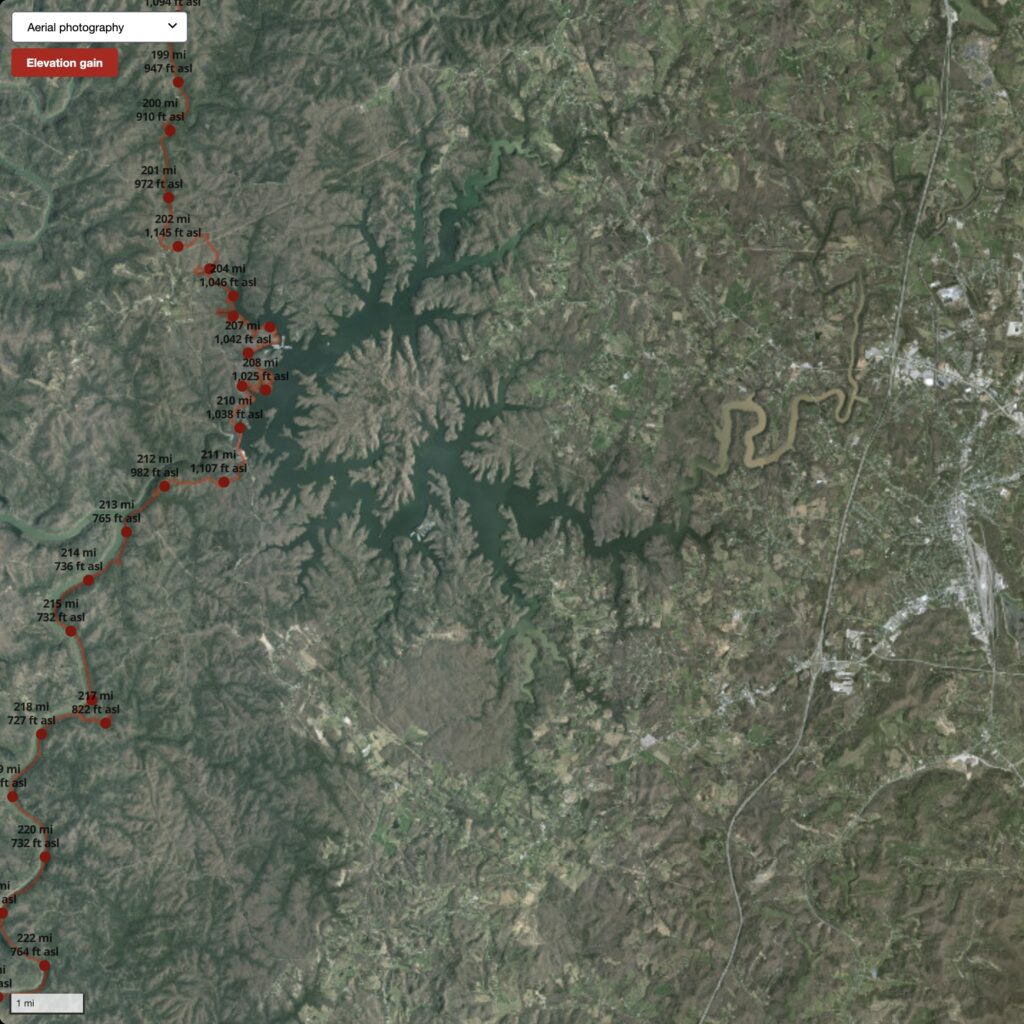
Screenshot of aerial photography map at SheltoweeTrace.com

One can identify the distribution of basic forest types and habitat patterns. The NLCD can be useful for understanding the extent of the wildland-urban interface — a vital consideration for Trail Towns, maintaining wildlife corridors, and managing tourism development in the region.

The NLCD layer, in conjunction with other layers on the web map, provides a comprehensive view of the public lands in the region. Before your next trip to the Daniel Boone NF or Big South Fork NRRA, take a look at all layers to get a sense of the landscape you will be visiting.

Screenshot of lidar-derived shaded relief map at SheltoweeTrace.com
Screenshot of mined lands map at SheltoweeTrace.com
Screenshot of the general topographic map at SheltoweeTrace.com

The interactive map is available at: https://sheltoweetrace.com

Ridge Trail to Hensley Settlement

With 2,000 vertical feet, the hike to Hensley Settlement is a challenging mountain adventure. Cumberland Gap National Historical Park is Kentucky’s only mountain national park and sees the fraction of visitors that other parks and forests see. Why? It’s not easy to get to the Hensley Flats, a mountain-top grassland that the Hensley-Gibson families cultivated and lived for decades. The shortest route to Hensley is via Chadwell Gap, a 4-mile one-way trip. It’s steep. The next option is via the Civic Park trailhead, an 8-mile one-way trip. It’s steep and long. But, you’ll visit incredible destinations and overlooks, including the White Rocks overlook and Sand Cave, one of the largest rock shelters in the region. For an epic day or overnight, start at the Wilderness Road campground and take the Gibson Gap Trail to the Ridge Trail. You’ll be alone in the wilderness. When you get to Hensley, prepare yourself for a proper, crystal-clear mountain high.

Banjo tune, Cumberland Gap, performed by Rich Kirby @appalshop

Backpacking tips. This national park requires a free permit to camp in the backcountry. The cabin at Martins Fork, with three bunk beds and a fireplace, can be rented. Black bears are very active in the park. Drinking water can be hard to find on the Ridge Trail. Hensley Settlement has a water spigot that is available from spring through fall. The larger streams flow all year. The maps in the video show campsites. Hit me up for additional tips. Get lost and have a blast.

A simple GPS tool for the phone

If you visit this site often, you likely have a favorite map app on your phone. I certainly do and I have installed dozens of apps over the years. Most focus on placing your location as a dot on the map.

The dot

Any map app that shows your location as a dot on the map fosters a dependence on your exact location. We end up saying, "I am here" instead of asking "Where am I?"

To build strong spatial awareness, we should look at the dot after studying the plain map and doing an exercise in terrain association. Can we orient the map (best done with a paper map, folks) so that map north aligns with observed north? Can we then identify features on the map and estimate their distance from us?

These are questions in topograhic map reading. If you carefully observe your environment and compare its representation on the map, you will not need the dot.

When there was no dot

Let’s say the early 1990s. Before that time, we used paper maps. Soon after, handheld GPS units became popular and only showed coordinates for your position and maybe some other location statistics like speed, elevation, distance & bearing to next waypoint. They were often used with a paper map that had a grid (with linear units on a flat space) or a graticule (angular units on a curved space) that helped a user measure their location.

Using coordinates, we looked at the paper map’s margin for marks that pointed you to a general location. To find the exact location, we looked up and asked, "Where am I?" and compared the map with what we saw. We built a mental map of our surroundings. There was no dot.

An app without a dot?

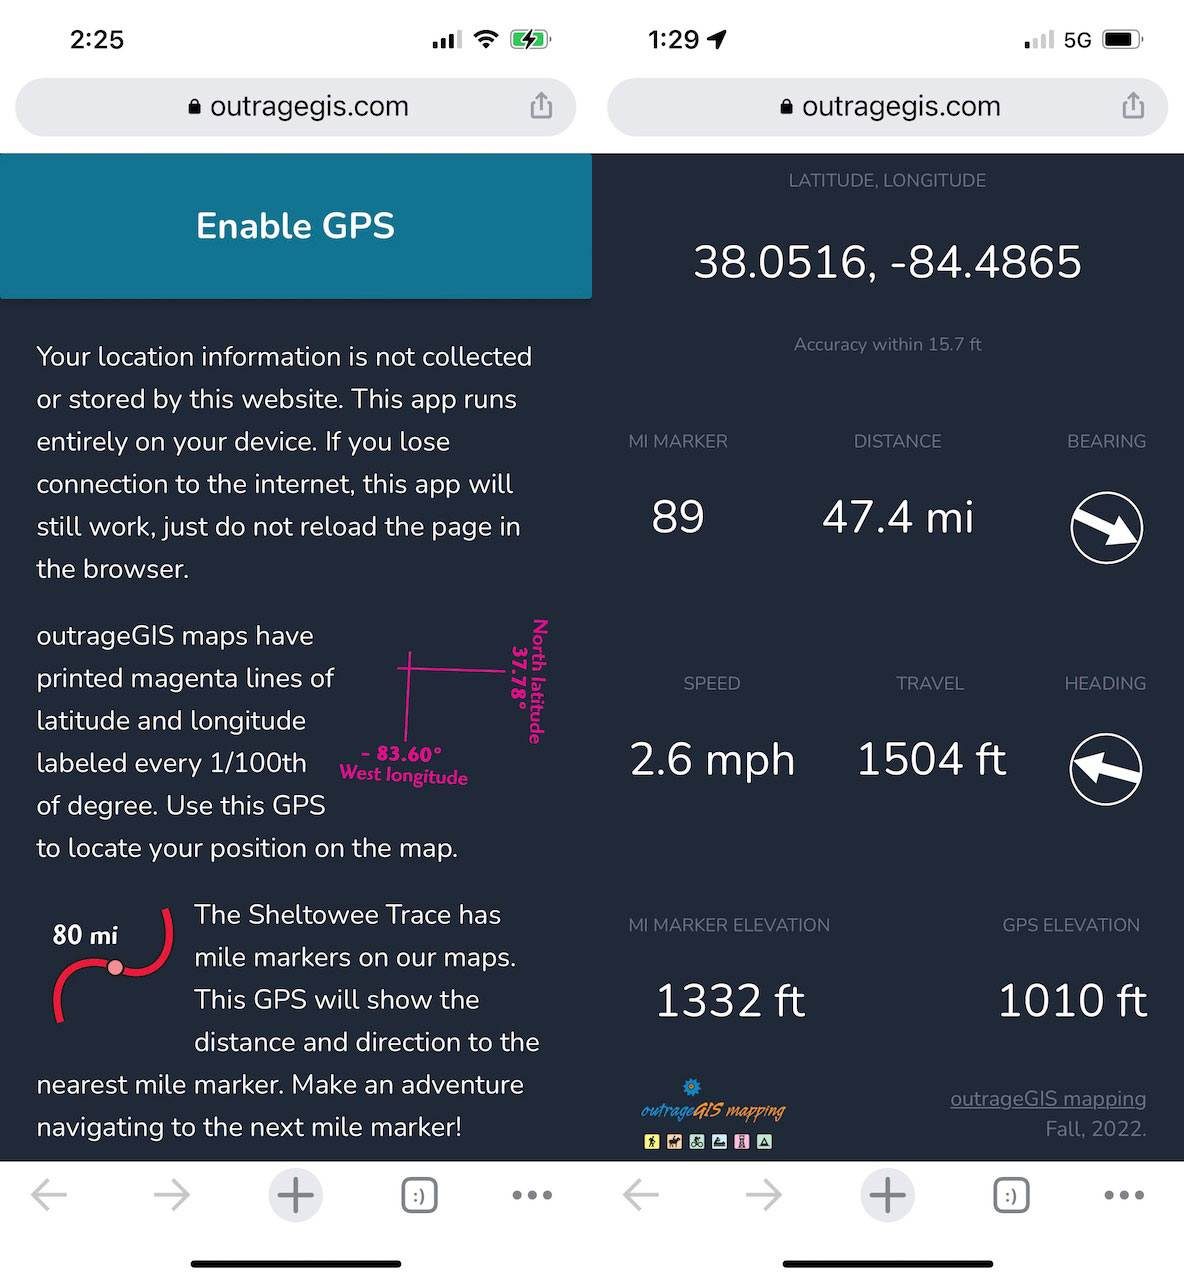
So, we thought we would kick it back to the 90s and make a browser app that mimics these early devices. Because our maps have detailed graticules and mile markers for the Sheltowee Trace, this app should compliment your journey into topography and map reading. This app is designed for mobile devices and below is a screen capture of a use on an iPhone.

GPS app can be loaded here: https://outrageGIS.com/gps

This app is free, open source, doesn’t need to be installed, and won’t collect any information from you.

Happy adventures!

New images and data from GOES-16

Visit the page to view and download imagery

Over Christmas break, it was time to automate collecting and displaying the incredibly detailed imagery from the GOES-16 Advanced Baseline Imager. A problem that plagued previous efforts was not accessing the raw data, a netCDF formatted file for the contiguous U.S. which can be downloaded freely from a variety of cloud data hosts. With the raw data, one can project, modify and use it in web mapping libraries like Leaflet.

This page offers a slippy map of grayscale and color imagery and is updated every 15 minutes. You can download GeoTIFFs of rendered layers that can be used in GIS applications.

Maps at the Woodland Art Fair, August 19-20

2016 Cumberland Gap trail map and hiking information

The update to our Cumberland Gap National Historical Park is now available. Much like the old map, our 2017 version is a 1 inch to 1/2 mile scale map with 50-foot contours, trail elevation profiles, and  GPS-mapped trails shown in vivid full-color printing. This year we added a layer that shows the density of canopy coverage and GPS-mapped Caldwell Gap Trail. The size of the park has increased since our last update, so we’ve included most of the additional land.


Gap weather page using Dark Sky weather data

Weather Station

We also have updated our weather page for the high mountain elevations for Cumberland Gap using hourly forecast information and time-lapse satellite photography. This will help plan your latest adventure to unique mountain environment of Cumberland Gap. You can find the weather station here: https://outrageGIS.com/weather/gap.

[Read more…]

Cumberland Gap weather station

Gap weather page using Dark Sky weather data

We’ve updated our Cumberland Gap National Historical Park weather station! With the release of our 2017 trail map for the Gap, we decided to go in a new direction for our weather station. Our stations for the Daniel Boone and Great Smokies pull data and images from the National Weather Service. We then use ImageMagick and other UNIX utilities to process the data. It is kinda old-school, but it has worked well for years.

With the Gap weather station, we decided to go with the Dark Sky team. They made a big impact a few years ago with their weather maps so we decided to try their extremely detailed point location forecast data.Their API is well documented and we use mostly Javascript to build the weather page. We focused on weather conditions at the top of the mountain since the park has over 2000 vertical feet of elevation relief. We couldn’t the same detail from the NWS. As we explore the mountains we’ll compare the relative advantages of both of these data sources.

You can find the mountain top weather page here: https://outrageGIS.com/weather/gap

Cumberland Gap NHP interactive map

Interactive 3d map using Leaflet

A bird’s eye view map of Cumberland Gap National Historical Park created in conjunction with our 2016 new release of the park map. This map is not georeferenced to real-world coordinates and uses a javascript mapping library, Leaflet, to generate the interactivity. We think of the developing project as a gateway for multimedia about the park’s environment and history that we want to share.

https://outrageGIS.com/gap/3d


Cumberland Gap trail map at Woodland Art Fair, August 20-21

2016 Cumberland Gap trail map and hiking information

The update to our Cumberland Gap National Historical Park is almost complete. Much like the old map, our 2016 version is a 1 inch to 1/2 mile scale map with 50-foot contours, trail elevation profiles, and  GPS-mapped trails shown in vivid full-color printing. This year we added a layer that shows density of canopy coverage and GPS-mapped Caldwell Gap Trail. The size of the park has increased since our last update, so we’ve included most of the additional land. [Read more…]

Audio driving tour on SoundCloud

Listen to audio

We’ve added our audio driving tour for Cumberland Gap and Pine Mountain to SoundCloud. This self-guided tour will show you over ancient buffalo traces and Native American trails that frontier settlers cut into roads seeking the fertile lands of Kentucky. You will walk through Cumberland Gap where the Wilderness Road and the Warrior’s Path meet and look out upon America’s First Frontier. Along the Kingdom Come Scenic Parkway, you will hear the rushing headwaters of the mighty Cumberland River.

https://soundcloud.com/boydx

Download audio and maps: http://www.firstfrontier.org/tour/FirstFrontier-Audio196kbps.zip

Pine Mountain Canopy Tour

Canopy zipline tour mapping assignment

What wild weekend and mapping task! Boyd led an undergraduate GIS class at the University of Kentucky and endeavored to map and analyze environmental tourism assets on Pine Mountain. During discussions with Pine Mountain State Resort Park, we discovered a canopy zipline tour, one of the first in the state, was being installed in the park. [Read more…]

Topography and Hemlock Habitat

Elevation range in feet within an area 164-foot square

Sheltered coves and north-facing cliffs are hemlock habitats in Eastern Kentucky. This map shows range of elevation change within a 164-foot square area. Red areas indicate the highest relief, which are mountain slopes in the coal fields, and cliffs along the Pottsville Escarpment and Pine and Cumberland Mountains fault. Since most cliff is sandstone, areas indicated as cliffs would presumably have sandy soils, which is a condition for other evergreen species habitats, e.g., mountain laurel and rhododendron.

This is first-run test. Further analysis would include adding aspect, evergreen canopy cover, and soils to better refine predicting hemlock habitat.

Kentucky transitions into fall

MODIS images of changing seasons in Kentucky, 2013


These satellite images are from the Moderate Resolution Imaging Spectroradiometer (MODIS) instruments on two satellites, Aqua and Terra. MODIS captures 36 electromagnetic wavelength bands to measure atmospheric water vapor, ozone, aerosols, land fire, surface temperature, and many other important variables of global climate. These images are visible light and clearly show the change in deciduous canopy cover within roughly a month of time. Spatial resolutions are between 250 m to 1 km.

El Niño to make the mountains colder and drier this winter

Predicting climate in the old days relied upon observing cues in nature. The Farmers’ Almanac finds that people looked at woolly worms in late summer in get a sense of winter. The more black hairs on the worm, the colder and wetter the winter. Of course woolly worms come in all configurations of black and orange colorings so how could a worm’s coat predict winter? It can as an analogy;  you look at the forecast to decide which coat you’re going to wear before leaving home. I think you would want to wear a black coat as opposed to a white coat on a very cold and sunny day to maximize the amount of solar energy you could absorb. Woolly worms just plan far ahead.

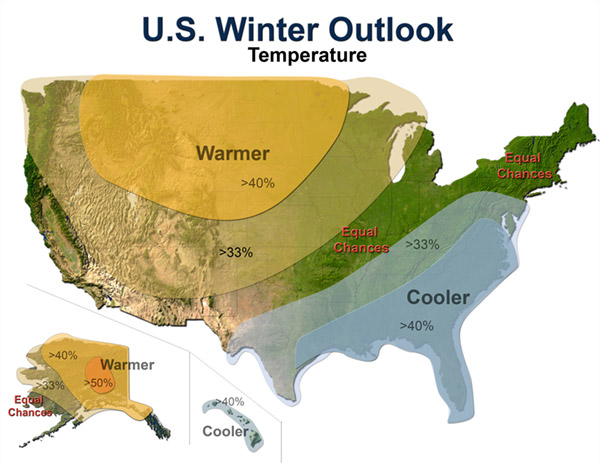
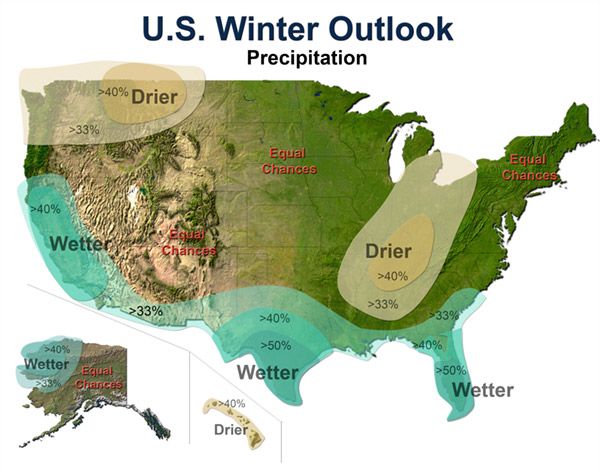
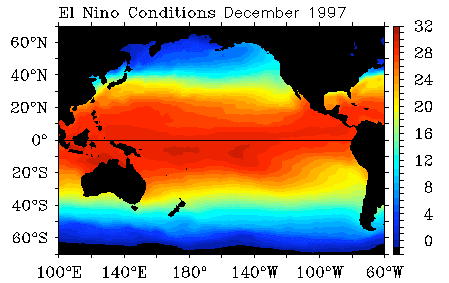
Today we track global changes in wind patterns and sea surface temperatures to predict weather conditions. NOAA’s Climate Prediction Center has issued a climate forecast for this winter based on the El Niño pattern emerging in the Pacific Ocean.

Below are winter predictions for the U.S. indicating greater or lesser chances for departures in average winter temperatures and precipitation.

El Niño is a departure from average sea surface temperatures created by a change in the intensity and direction of equatorial winds. In a normal period, strong easterly trade winds blow across the Pacific and upwell cold, nutrient rich waters on the west coast of South America. These same winds also pile up water in the western Pacific so that the sea surface is about 2 feet higher at Indonesia than at Ecuador.

In an El Niño cycle, the winds are not as intense and warmer sea surface temperatures extend further to east. This change has a global impact on weather with increased precipitation on the west coast of South America and the south & east coasts of North America. Warmer than normal conditions also occur at higher latitudes in North America and over the Pacific ocean.

El Niño Sea Surface Temperatures in °C

Rainy May: on track to be the wettest May ever

Spring is typically a wet month. However over the past week, Eastern Kentucky has experienced unusual rainfall amounts. The record for the month is 10.78 inches in 2004; and no other year has been above 10 inches for May. The only year that saw over 9 inches of rainfall for May was in 1995. May during 1983 and 1984 were the only times over 7 inches of rainfall.

From the National Weather Service in Jackson, Kentucky:

"2 TO 5 INCHES OF RAIN HAS FALLEN ACROSS EASTERN KENTUCKY DURING THE
MONTH OF MAY. THIS IS OF INTEREST...SINCE WE ARE ONLY ABOUT ONE
QUARTER OF THE WAY THROUGH THE MONTH. HEAVY RAINFALL IS VERY
POSSIBLE AS WE HEAD INTO MOTHERS DAY WEEKEND AND COULD PUSH RAINFALL
AMOUNTS UP ANOTHER INCH OR TWO.

THE AVERAGE PRECIPITATION FOR THE MONTH OF MAY AT THE JACKSON
WEATHER OFFICE IS 4.92 INCHES. WE HAVE ALL READY RECORDED 4.12
INCHES OF RAINFALL AS OF THIS MORNING AT 7AM. IT IS TOO EARLY TO TELL
...BUT WE ARE CERTAINLY ON TRACK TO HAVE ONE OF THE RAINIEST MAYS
EVER. THE RAINIEST MAY OCCURRED IN 2004 WHEN THE JACKSON WEATHER
OFFICE RECORDED 10.78 INCHES FOR THE MONTH. THIS WAS THE ONLY MONTH
OF MAY THAT OVER TEN INCHES OF RAIN FELL. MAY OF 1995 HAD 9.91
INCHES AND WAS THE ONLY MONTH WITH OVER 9 INCHES RECORDED. THE NEXT
HIGHEST TOTALS WERE OVER 7 INCHES AND THAT OCCURRED IN ONLY TWO
YEARS...1983 AND 1984.

HERE ARE RAINFALL TOTALS FROM EASTERN KENTUCKY COOPERATIVE WEATHER
STATIONS AND AUTOMATED SURFACE OBSERVING SYSTEMS AS OF 7 AM
EDT...FOR THE MONTH OF MAY 2009.

LOCATION         /   COUNTY     /     PRECIPITATION

BARBOURVILLE         KNOX              4.38  INCHES
BAXTER               HARLAN            3.85  INCHES
BEATTYVILLE 4N       LEE               3.68  INCHES
BIG SHELBY           PIKE              3.01  INCHES
BOONEVILLE 1SE       OWSLEY            4.49  INCHES
BUCKHORN LAKE        PERRY             2.80  INCHES
CARR CREEK LAKE      KNOTT             2.73  INCHES
CAVE RUN LAKE        ROWAN             2.28  INCHES
CLAY CITY 1WNW       POWELL            2.77  INCHES
CLOSPLINT 4ESE       HARLAN            4.55  INCHES
COLO                 PULASKI           3.98  INCHES
CRESSY               ESTILL            2.59  INCHES
DRAFFIN              PIKE              3.54  INCHES
EZEL                 MORGAN            3.31  INCHES
GIMLET               ELLIOTT           2.60  INCHES
HARLAN 1S            HARLAN            3.80  INCHES
HARLAN STATE POLICE  HARLAN            2.95  INCHES
HAZARD WATER         PERRY             3.71  INCHES
HAZARD               PERRY             3.70  INCHES
HAZARD STATE POLICE  PERRY             2.95  INCHES
HEIDELBERG 2N        LEE               4.05  INCHES
BAXTER               HARLAN            3.85  INCHES
INEZ 2E              MARTIN            3.78  INCHES
ISLAND CITY          OWSLEY            5.16  INCHES
IVEL                 FLOYD             2.27  INCHES
NWS JACKSON          BREATHITT         4.12  INCHES
JEREMIAH 1S          LETCHER           3.11  INCHES
KINGDOM COME ST PARK HARLAN            3.12  INCHES
LONDON CORBIN APT    LAUREL            4.46  INCHES
MONTICELLO 3NE       WAYNE             4.00  INCHES
MOUNT STERLING 5N    MONTGOMERY        2.41  INCHES
MOUNT VERNON         ROCKCASTLE        2.77  INCHES
ONEIDA               CLAY              4.54  INCHES
PAINTSVILLE 1E       JOHNSON           3.55  INCHES
PIKEVILLE ST POLICE  PIKE              2.05  INCHES
PRESTONSBURG 3NW     FLOYD             4.09  INCHES
QUICKSAND            BREATHITT         3.52  INCHES
RELIEF               MORGAN            3.18  INCHES
ROGERS               WOLFE             2.82  INCHES
SALYERSVILLE         MAGOFFIN          4.28  INCHES
SANDY HOOK           ELLIOTT           2.67  INCHES
SKYLINE              LETCHER           3.20  INCHES
SLADE 5NE            POWELL            2.86  INCHES
SOMERSET 2N          PULASKI           3.74  INCHES
STANTON 2W           POWELL            2.88  INCHES
STEARNS 2S           MCCREARY          5.09  INCHES
VICTORY 5NW          LAUREL            4.13  INCHES
WEST LIBERTY 3NW     MORGAN            2.67  INCHES
WEST LIBERTY 11NW    MORGAN            2.57  INCHES
WHITESBURG           LETCHER           2.50  INCHES
WHITESBURG 2SE       LETCHER           3.21  INCHES
WILLIAMSBURG 1NW     WHITLEY           5.14  INCHES

THE NATIONAL WEATHER SERVICE AT JACKSON WOULD LIKE TO THANK ALL THE
DEDICATED COOPERATIVE WEATHER OBSERVERS FOR THEIR TIMELY REPORTS."

First Frontier Audio Driving Tour

Download and print the two-hour audio driving tour.

What trails will you blaze through this new frontier?

You will travel over ancient buffalo traces and Native American trails that frontier settlers cut into roads seeking the fertile lands of Kentucky. You will walk through Cumberland Gap where the Wilderness Road and the Warrior’s Path meet and look out upon America’s First Frontier. Along the Kingdom Come Scenic Parkway, you will hear the rushing headwaters of the mighty Cumberland River.

Download Hi quality (220 meg)

For adventuresome spirits, the unexplored road lures you to rugged mountain settlements and luxuriant coves of rhododendron blooms. Autumn hues of amber and scarlet sweeten your memories of fall vacations. Springtime stirs enchanting old-time songs and the colors of redbuds and dogwoods in our mountain festivals.

Website

0

Your Cart

pFad - Phonifier reborn

Pfad - The Proxy pFad of © 2024 Garber Painting. All rights reserved.

Note: This service is not intended for secure transactions such as banking, social media, email, or purchasing. Use at your own risk. We assume no liability whatsoever for broken pages.


Alternative Proxies:

Alternative Proxy

pFad Proxy

pFad v3 Proxy

pFad v4 Proxy