National Weather Service United States Department of Commerce

Preliminary (unofficial) Annual Climate Plots

Click on each graph for a larger version
Click here for plot explanation or visit the National Centers for Environmental Information (NCEI) for certified (official) climate data.


the thumbnail image of the Pittsburgh Climate Data


Pittsburgh, PA


the thumbnail image of the Morgantown Climate Data

 
Morgantown, WV


the thumbnail image of the St Zanesville Climate Data


Zanesville, OH


Monthly Observations/Normals/Records

Select drop-down menu for other sites and months

Site:


Select a Pittsburgh, PA climate topic from the following options:


Select from the following options to see climate normals:


Latest NWS Pittsburgh Climate Briefing


6-10 Day Outlook

8-14 Day Outlook

Temperature
Climate Prediction Center 6 to 10 day Temperature Outlook
Precipitation
Climate Prediction Center 6 to 10 day Precipitation Outlook
Temperature
Climate Prediction Center 8 to 14 day Temperature Outlook
Precipitation
Climate Prediction Center 8 to 14 day Precipitation Outlook
 
Temperature and precipitation outlooks for the 6-10 day and 8-14 day periods. Issued daily by the NOAA/NWS Climate Prediction Center. The outlooks express forecast probability that temperatures or total precipitation in the 6-10 or 8-14 day period will tend to be similar to the 10-highest ("above-normal"), middle-10 ("near-normal"), or 10-lowest ("below-normal") observed in the 1981-2010 normals period. Color shading on the outlook maps follows standard convention for warmer/colder or wetter/drier, with near-normal in white. Darker shades of red or blue (or green and brown) indicate a higher forecast probability.


One Month Outlook

Three Month Outlook

Temperature
Climate Prediction Center 1 Month Temperature Outlook
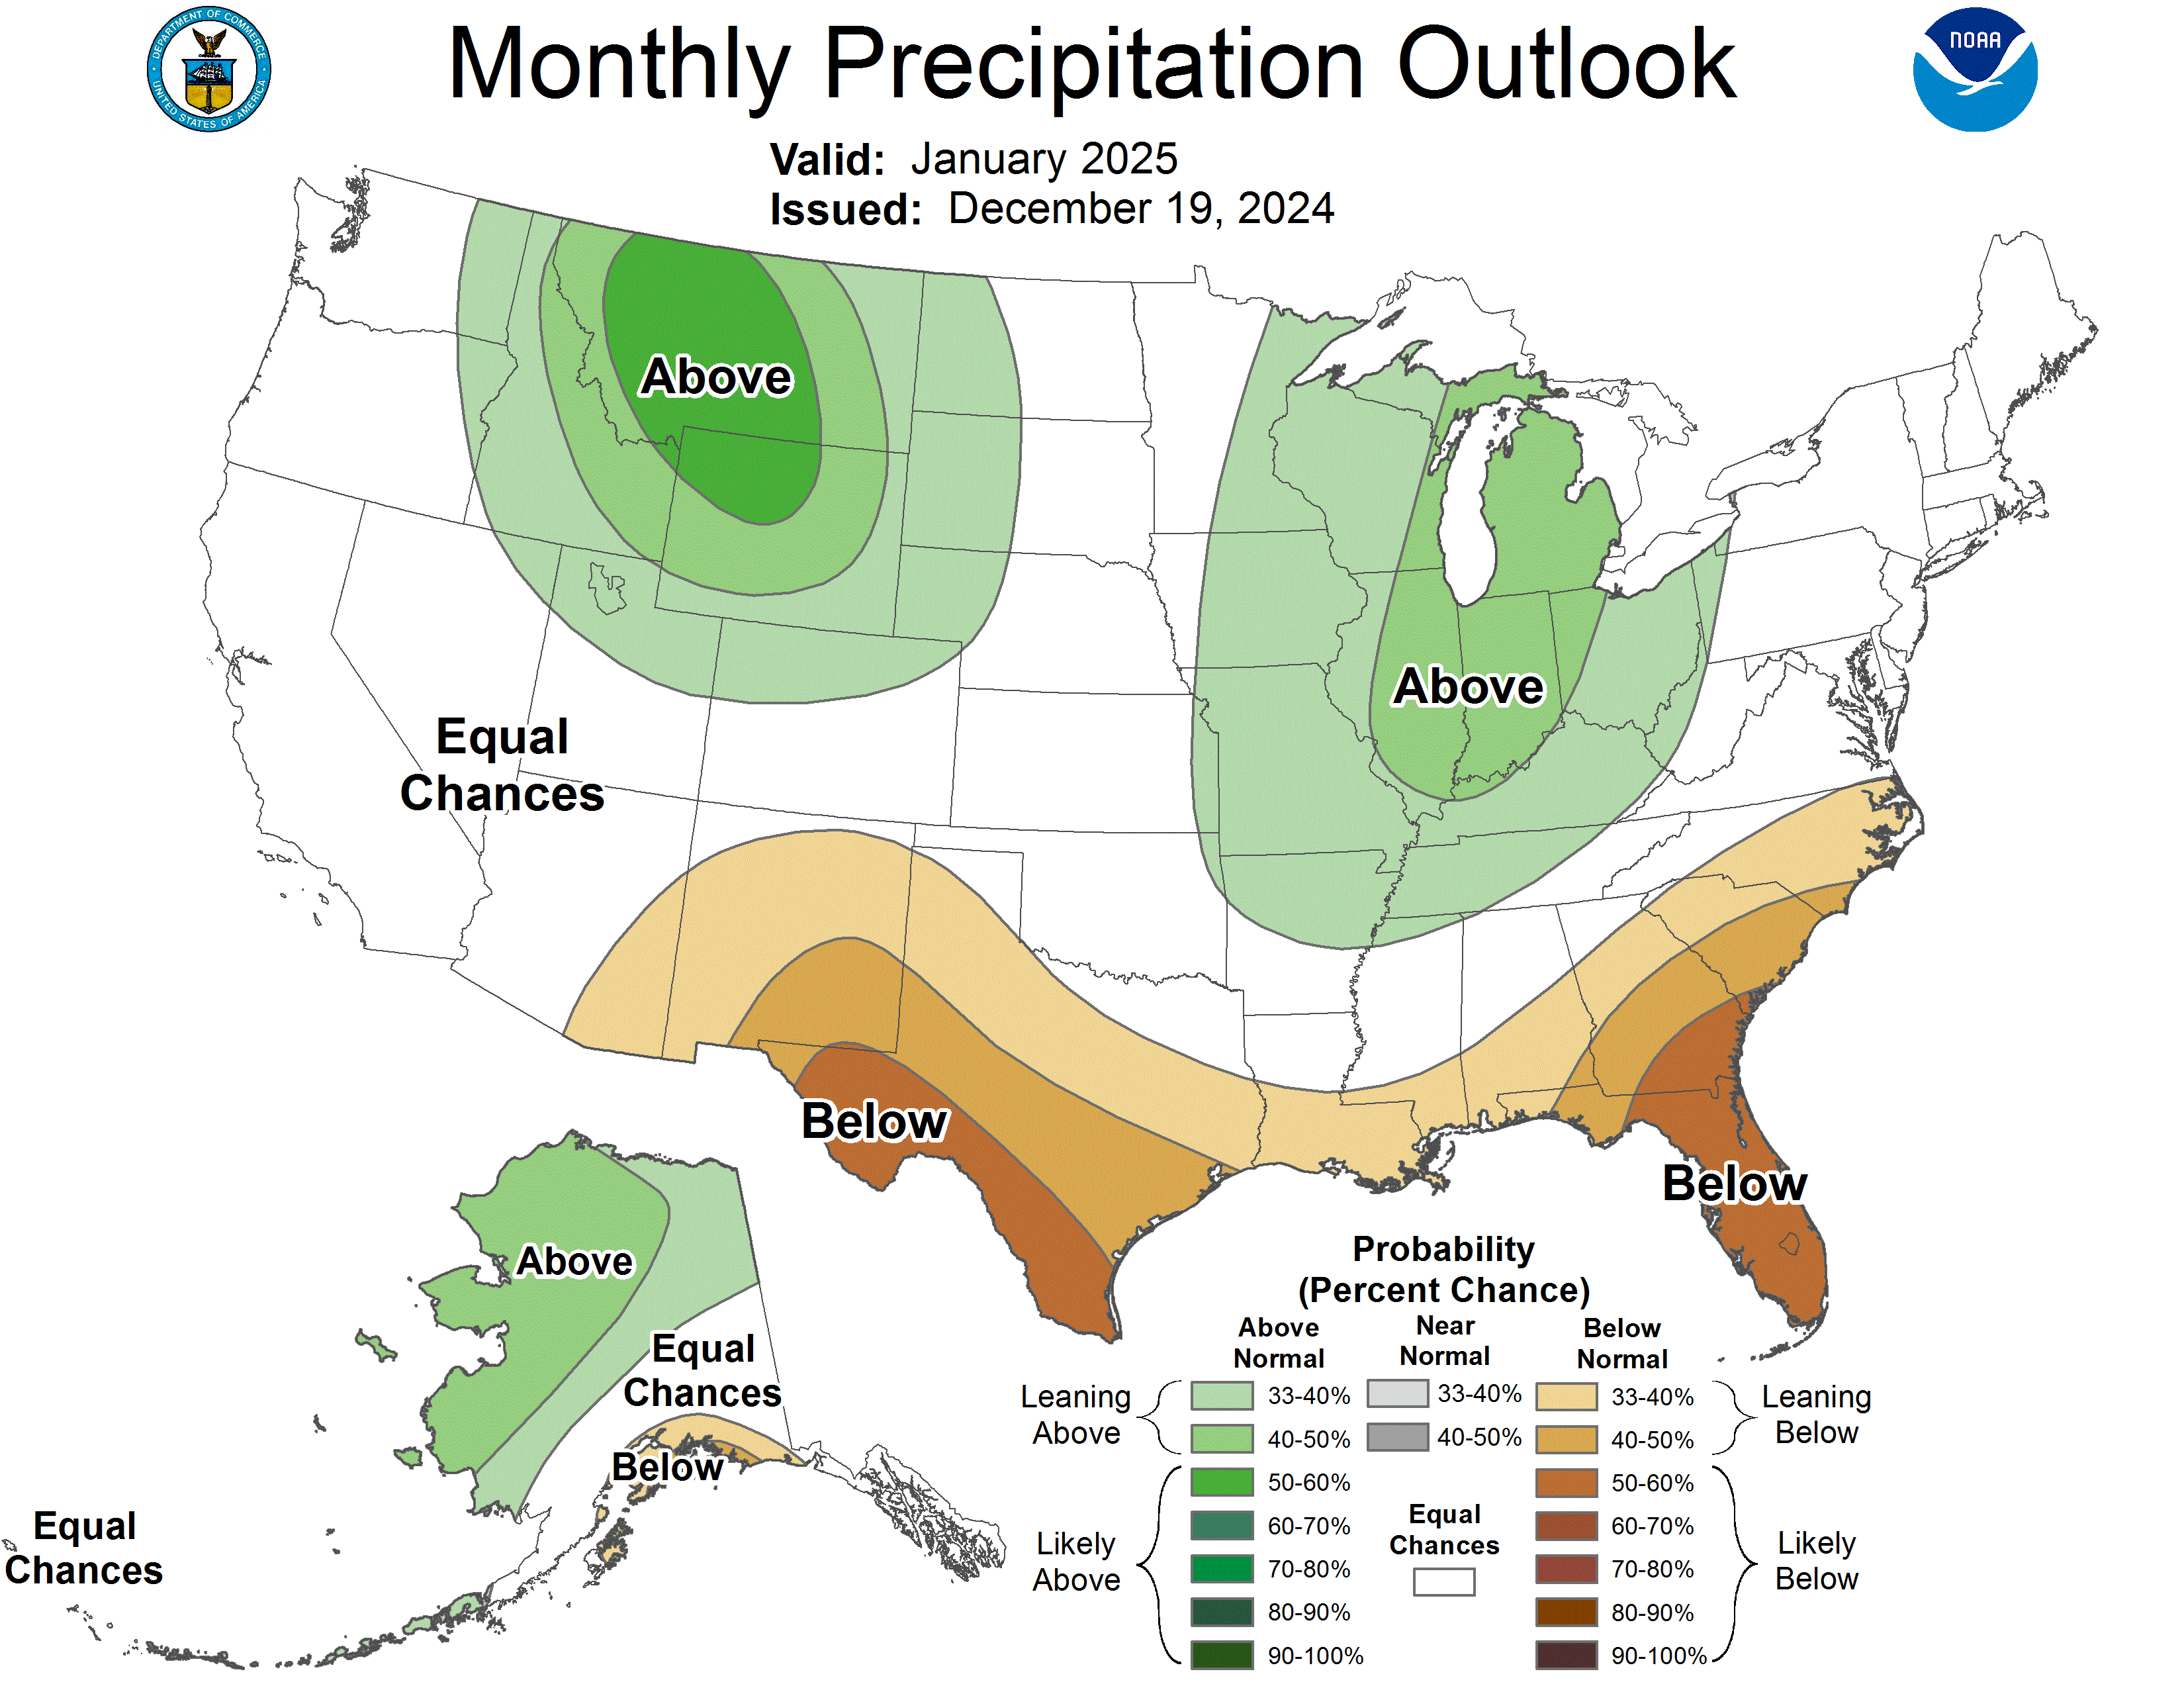
Precipitation
Climate Prediction Center 1 Month Precipitation Outlook
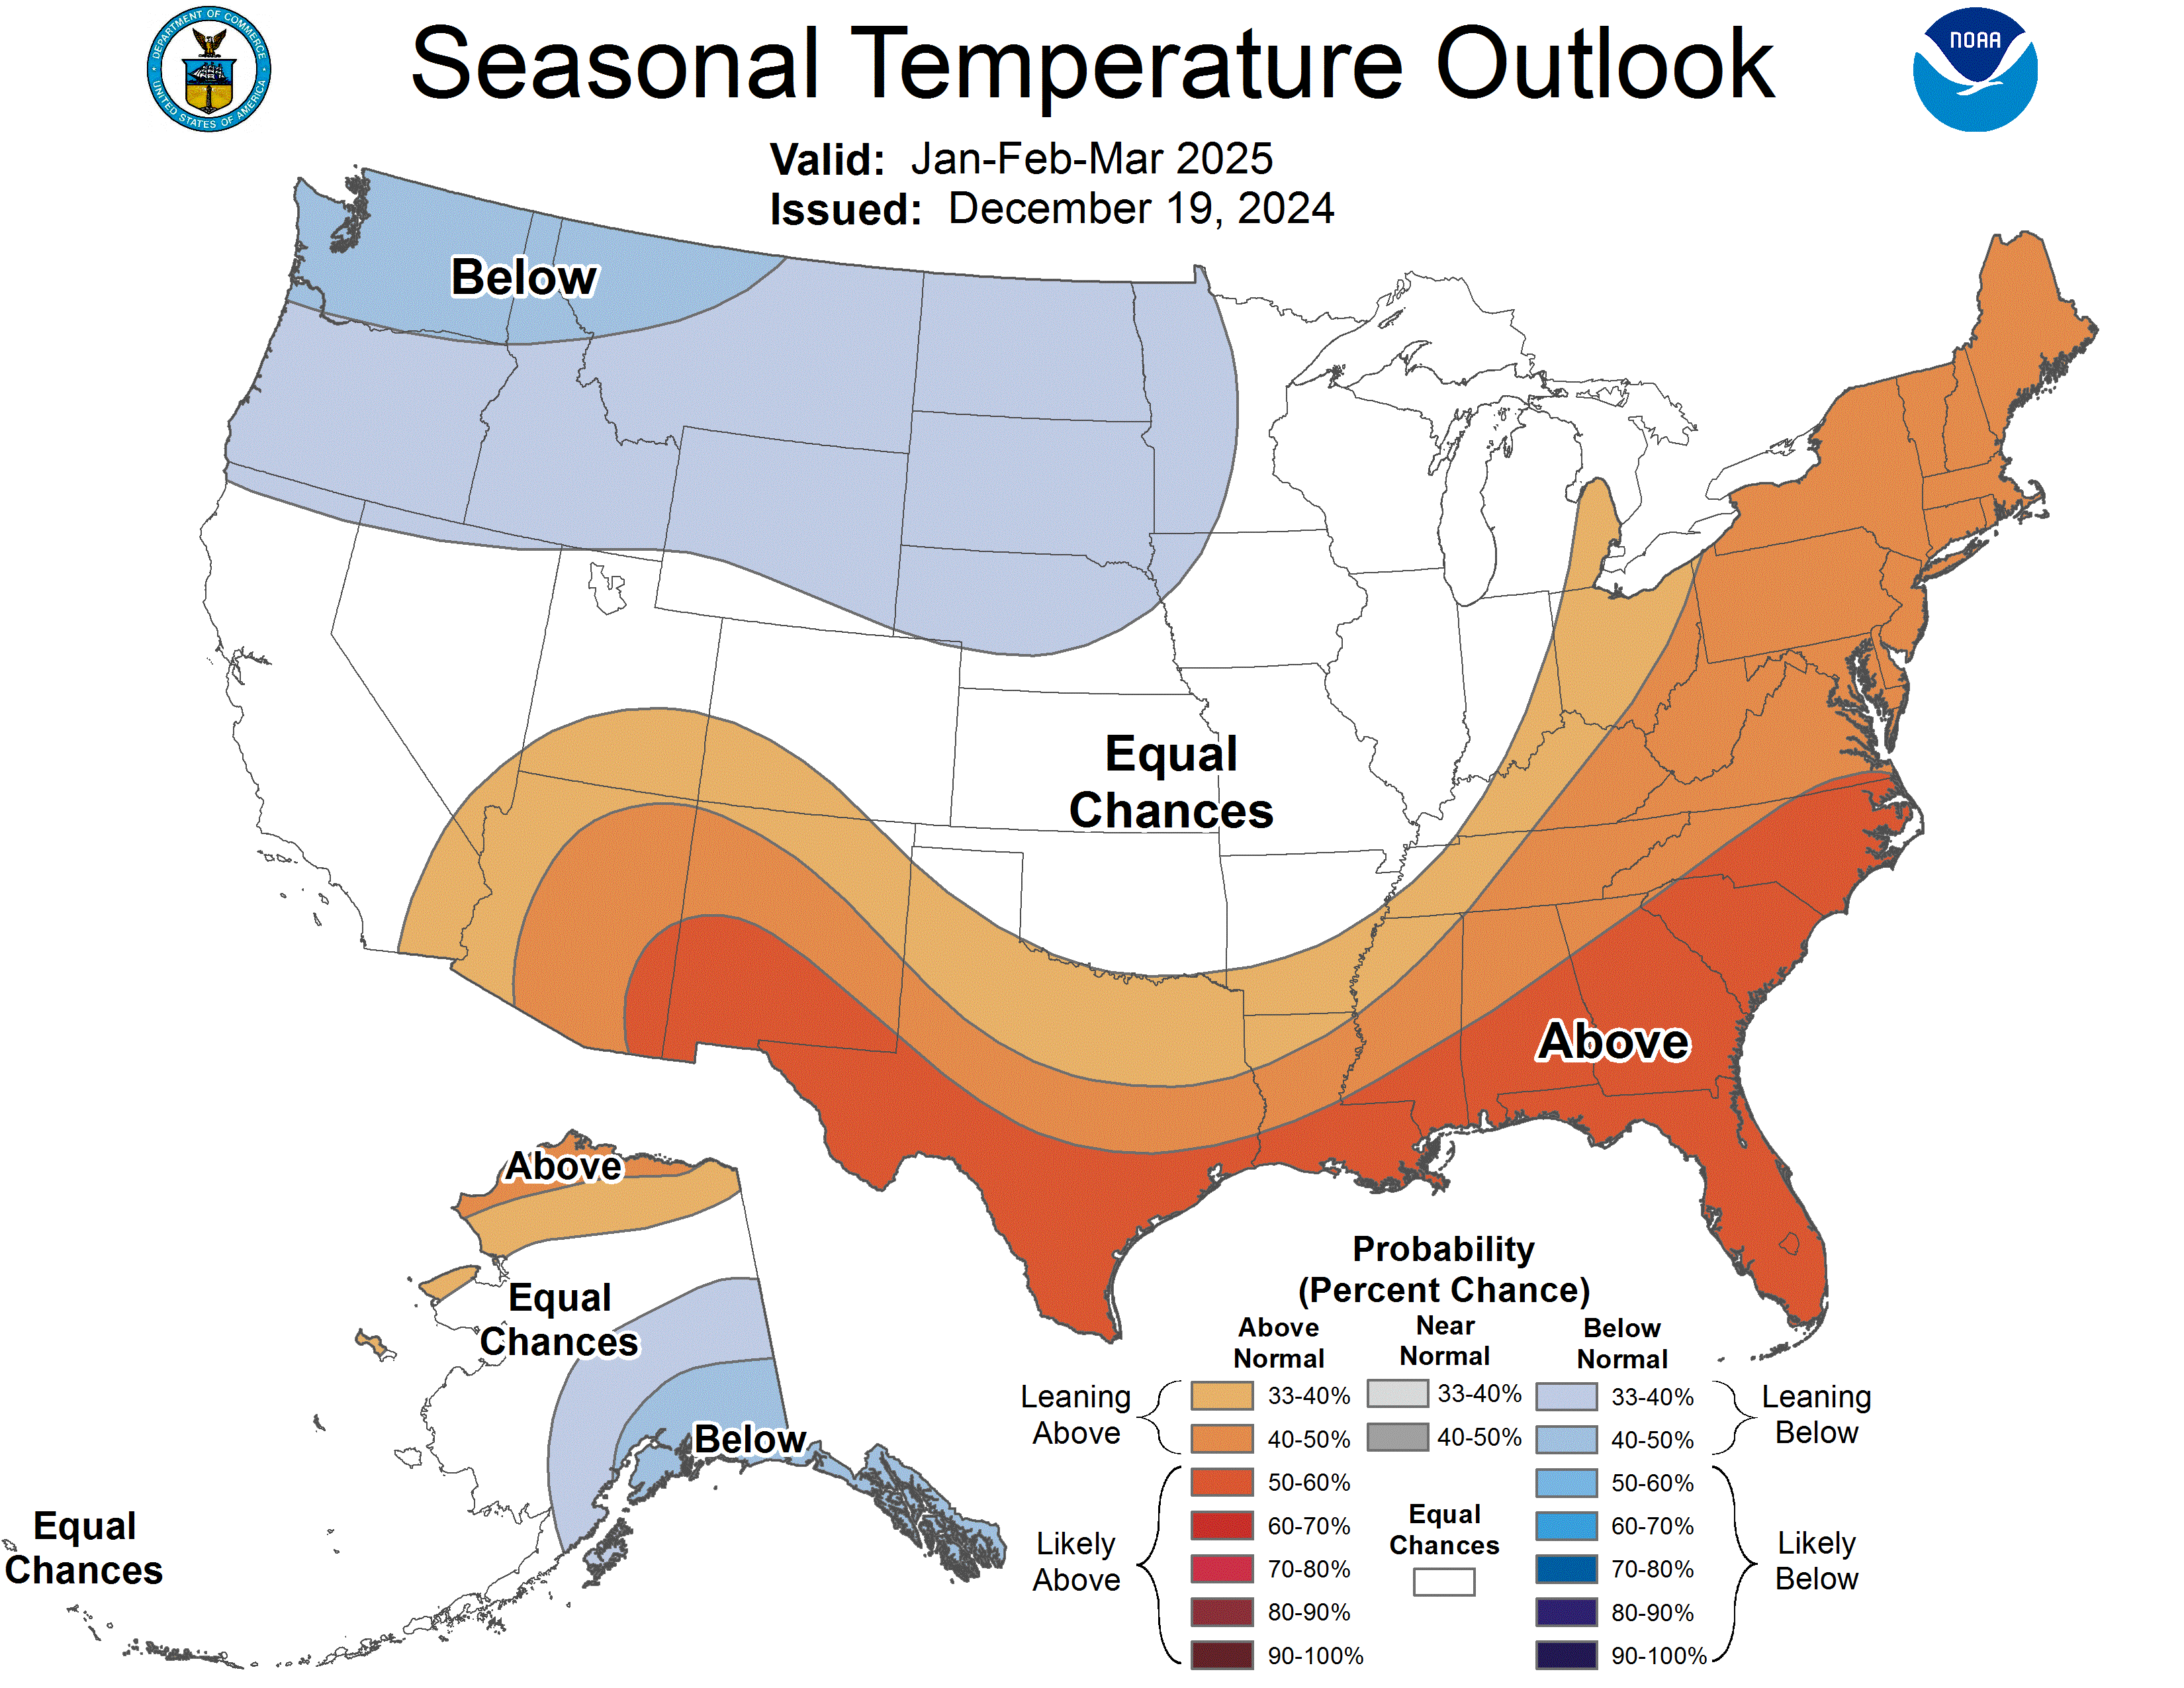
Temperature
Climate Prediction Center 3 Month Temperature Outlook
Precipitation
Climate Prediction Center 3 Month Precipitation Outlook
 
One Month and Three-Month temperature and precipitation outlooks. The outlooks are issued by the Climate Prediction Center on the last day of each month (valid for the following month), with an update to the outlook on the third Thursday of the following month. The monthly and seasonal outlooks are similar to the 6-10 and 8-14 day outlooks. However, in areas where "Equal Chances" (EC) is shown, it means that climate signals do not favor either above- or below-normal, and above-, near-, or below-normal forecast categories are equally likely to occur. A forecast of Equal Chances does NOT necessarily mean forecast conditions are expected to be near-normal.

This page provides an overview of tornado climatology for the Pittsburgh, PA (PBZ) CWA since 1950. Visit this severe weather climatology page for a more detailed examination of the NWS Pittsburgh, PA (PBZ) County Warning Area severe climatology.


Tornadoes


Allegheny County Butler County Beaver County Lawrence County Washington County Westmoreland County Mercer County Venango County Forest County Clarion County Armstrong County Jefferson County Indiana County Greene County Fayette County Hancock County Brooke County Ohio County Marshall County Wetzel County Monongalia County Marion County Preston County Tucker County Columbiana County Carroll County Tuscarawas County Harrison County Jefferson County Coshocton County Muskingum County Guernsey County Belmont County Noble County Monroe County


This page provides an overview of flash flood climatology for the Pittsburgh, PA (PBZ) CWA since 1986.


Flash Floods can be caused by a number of factors, but is most often due to extremely heavy rainfall from thunderstorms. Flash Floods can also occur due to excessive runoff from melting snow, ice jams, or Dam/Levee Breaks. The intensity and location/distribution of rainfall plays a significant factor in flash flooding, but other factors that contribute are land use, soil type, topography, vegetation type/density, and soil water-content. These all determine if and how quickly Flash Flooding may occur.

Urban areas within our forecast area are also prone to flash flooding in short time-spans as the impervious surfaces in the urban areas do not allow water to infiltrate the ground, and the water runs off to the low spots very quickly. Clogged drains and culverts within urban settings can further exacerbate flooding problems.

It is important to view these severe weather reports as just that, reports. We rely heavily on Skywarn Spotters, Broadcast Media, Cooperative Observers, County Officials, and the Public for severe weather reports. While we remain diligent in our efforts to document every occurence of flooding, we understand that a lot of cases go unrecorded.


Click on each thumbnail to view the larger image

Flash Flood Reports by County
Flash Flood Reports by Year


Flash Flood Reports by Month Flash Flood Reports by Month (with PBZ Precipitable Water Climatology)


Two maximas are noted in the monthly graphs, a warm season spike (May-Aug) and a cool season spike (Jan). This shows that there are multiple factors at play. The warm season maxima is associated with thunderstorm activity over the Spring and Summer months when precipitatable water (the total amount of water in the column of atmosphere overhead) peaks and heavy downpours are common with thunderstorms. The right image contains the precipitable water climatology data derived from the Pittsburgh Upper Air Sounding. The cool season maxima can at least be partially attributed to rain falling on melting snow and/or ice jam issues. 


Flash Flood Reports by Hour


Two maximas are noted in the hourly graphs, an afternoon/evening spike (2-5pm EST) and a morning spike (6-9am EST). The afternoon/evening spike is a result of what you may expect, heavy downpours associated with thunderstorms that develop during the peak heating hours. The morning spike may actually be attributed more to human nature than environmental factors. This is the time of day when most people are travelling and may encounter a flooded roadway, either from earlier rainfall or from rain falling at that time.

 
pFad - Phonifier reborn

Pfad - The Proxy pFad of © 2024 Garber Painting. All rights reserved.

Note: This service is not intended for secure transactions such as banking, social media, email, or purchasing. Use at your own risk. We assume no liability whatsoever for broken pages.


Alternative Proxies:

Alternative Proxy

pFad Proxy

pFad v3 Proxy

pFad v4 Proxy