Skew-T Obervations and Analysis
☰ MenuThis section describes the usage of the MAG application to view Skew-T plots. Select the Observations/Analyses Type “SKEWT” from the Observations and Analyses page.
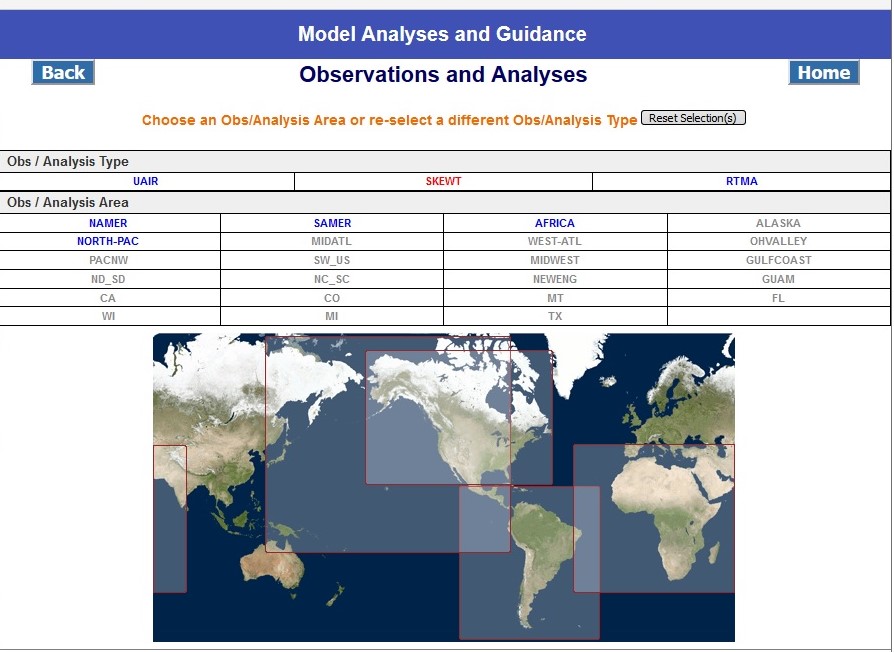
The geographic regions containing SKEWT plots are highlighted in blue. Regions not containing SKEWT plots are in gray. Select the desired region.
The figure below shows the Skew-T page for region North America (NAMER). The page displays the available cycles above a map of the chosen area.
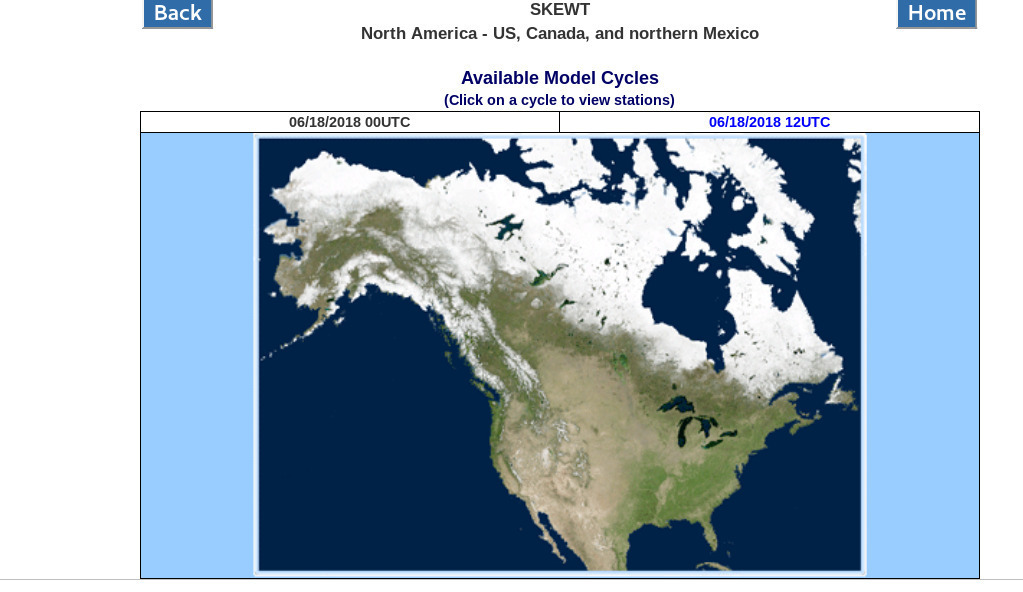
Select the desired cycle, and the user is presented with a map and red dots desinating stations.
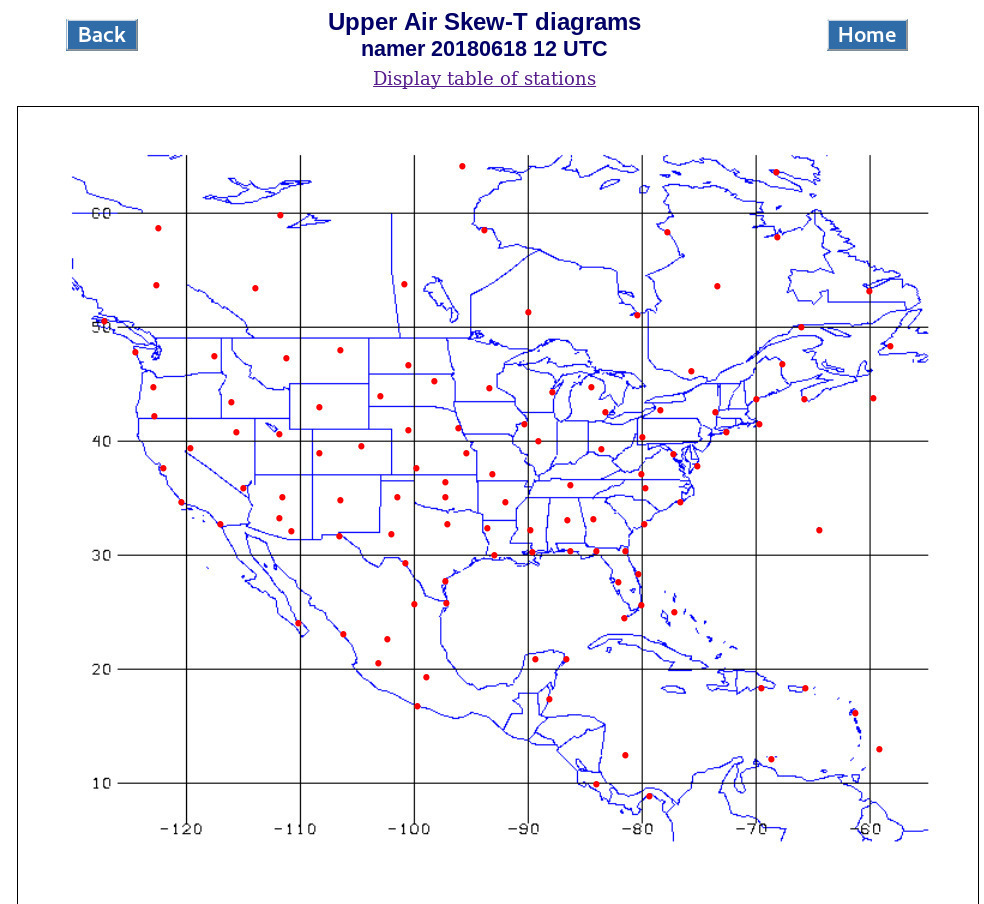
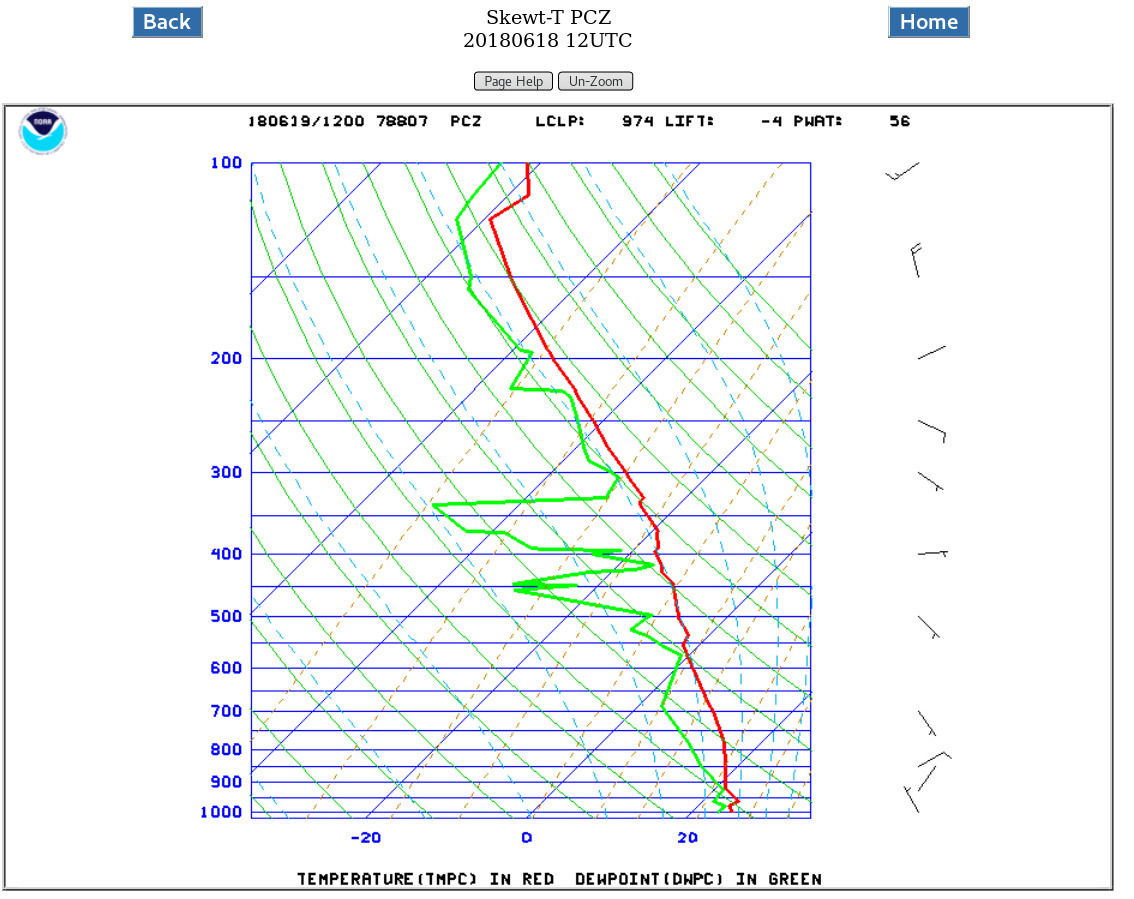
Click on a red dot to view the Skew-T plot for that station, as shown below.
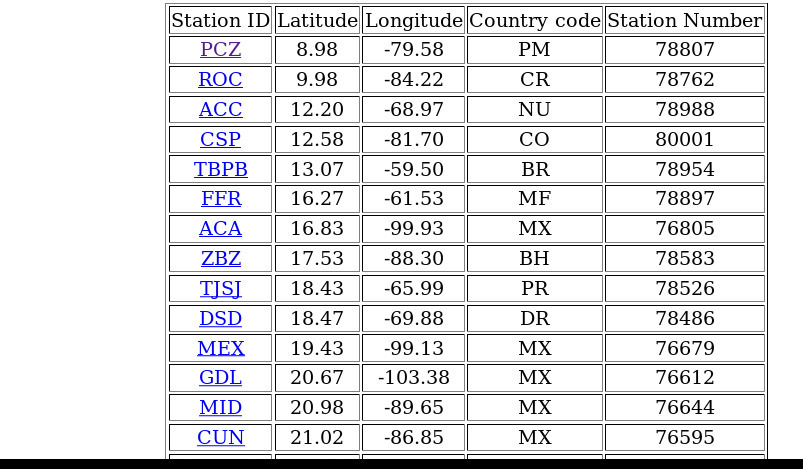
The display of Skew-T plots available can be listed in a table rather than on a map. When the user chooses a desired cycle, click on the hypertext link “Display Table of Stations” to get a list of stations (as shown below) instead of the regional map with red dots representing the various stations. The user can click on the station code to view the Skew-T plot.